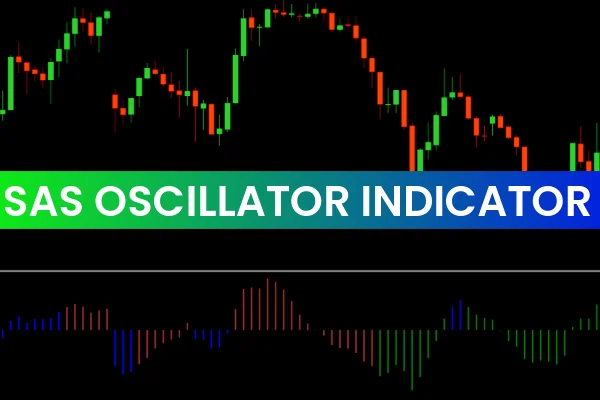
The SAS Oscillator Indicator MT4 is a powerful trend analysis and reversal detection tool designed for traders who want accurate momentum readings. This indicator helps identify market phases, trend exhaustion, and potential turning points using oscillator-style histogram levels. Whether you trade Forex, indices, crypto, or metals, the SAS Oscillator Indicator provides high-quality signals suitable for Scalping, day trading, and algorithmic strategies.
The SAS Oscillator Indicator works by analyzing the relationship between recent price movements and market volatility. As the histogram grows or shrinks, traders can determine whether momentum is strengthening or weakening. This makes it particularly useful for identifying early trend reversals before Price Action becomes obvious.
How the SAS Oscillator Indicator Works
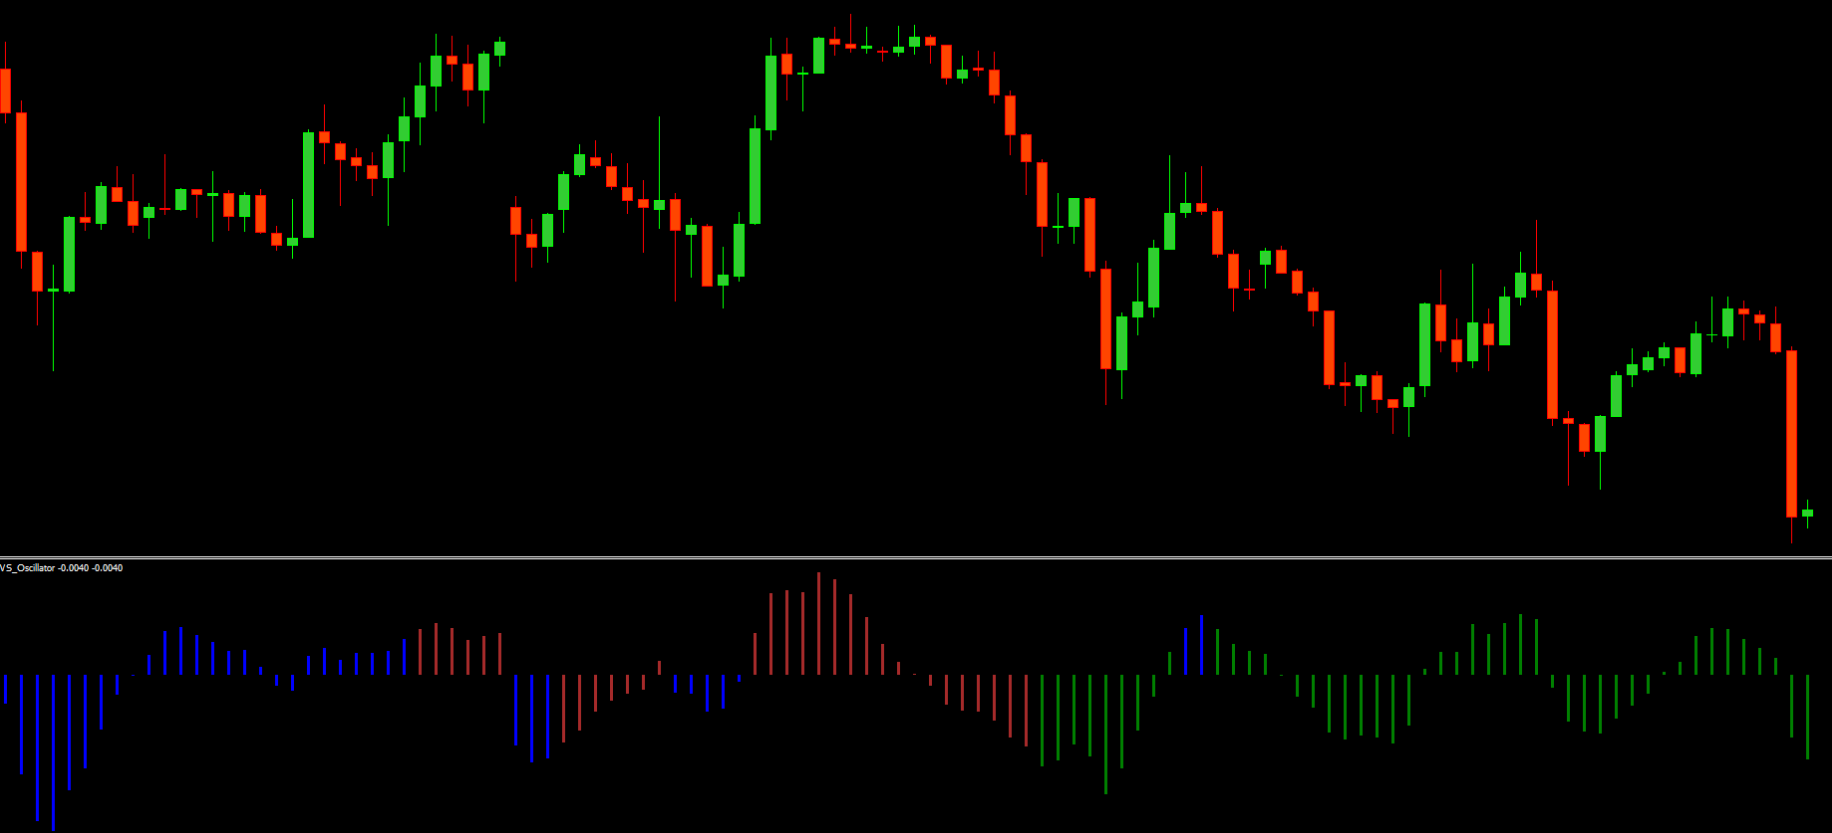
The SAS Oscillator Indicator generates real-time market feedback through a smoothing calculation that reacts to recent highs and lows. As price accelerates, the histogram expands, showing strong bullish or bearish momentum. When the histogram begins flattening or reversing direction, the indicator signals reduced momentum and a potential price shift.
This structure helps traders avoid emotional decisions and rely instead on objective technical signals.
Key Features of the SAS Oscillator Indicator MT4
Precision Momentum Reading
The indicator provides highly sensitive momentum detection, allowing traders to identify shifts earlier than most standard oscillators.
Clean and Clear Visual Output
The histogram layout is simple to read and interpret, making it suitable for both beginners and experienced algorithmic traders.
Versatile Trading Application
Whether using price action, Support And Resistance, moving averages, or smart money concepts, the SAS Oscillator Indicator integrates easily into any strategy.
How to Use the SAS Oscillator Indicator in Live Trading
Detecting Overbought and Oversold Conditions
When the histogram reaches extreme high levels, the market may be overbought. Likewise, when the histogram falls to extreme lows, the market may be oversold. These zones often precede trend corrections or complete reversals.
Confirming Trend Direction
If the histogram remains above the zero line, the trend is considered bullish. If it remains below, the trend is bearish. This is particularly useful when combined with moving averages or trendline analysis.
Entry and Exit Timing
A common approach is to wait for the histogram to cross the zero level:
Buy when the histogram crosses above zero
Sell when it crosses below zero
To improve accuracy, use the SAS Oscillator alongside a secondary confirmation tool such as RSI, MACD, or a Supply And Demand indicator.
Benefits of Using the SAS Oscillator Indicator
Early Trend Reversal insight
Better decision-making with visual signals
Works across all markets and timeframes
Reduces emotional bias in trading
With consistent use, traders can develop a structured decision process rather than relying on guesswork.
Download and Use the SAS Oscillator Indicator
You can download the SAS Oscillator Indicator MT4 and many more free tools at IndicatorForest.com. A full installation and usage guide is available on the download page.
For additional learning, visit our article on the Market Levels Trading System for MT4.
Conclusion
The SAS Oscillator Indicator MT4 is a highly valuable tool for traders who want accurate trend confirmation and reversal signals. Its visual clarity and analytical power make it suitable for beginner and professional traders alike. If you're looking to strengthen your analysis or automate signals, this indicator is a reliable addition to your strategy.
For more indicators, strategies, and expert tools, visit IndicatorForest.com.
FAQ
1 Download
Published:
Dec 09, 2025 08:54 AM
Category: