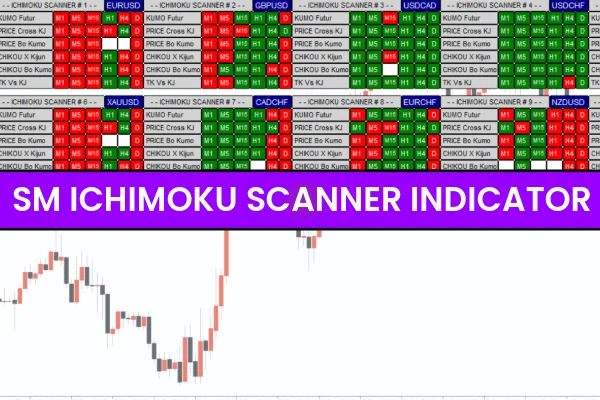
The Sm Ichimoku Scanner Indicator for MT4 is a powerful multi-timeframe forex scanning tool that automatically analyzes Ichimoku trading signals across multiple currency pairs. Instead of manually switching charts or timeframes, this indicator performs simultaneous analysis on up to 10 different pairs and displays the results visually on a compact, easy-to-read dashboard.
By integrating the full Ichimoku Kinko Hyo trading logic, the Sm Ichimoku Scanner Indicator for MT4 helps traders identify bullish or bearish opportunities without needing to continuously monitor multiple charts.
This makes it an excellent tool for scalpers, intraday traders, and swing traders who rely on Ichimoku components such as the Kumo Cloud, Tenkan-sen, Kijun-sen, and Chikou Span. Both beginner and advanced traders can use it to simplify the Ichimoku process and improve market efficiency.
How the Sm Ichimoku Scanner Indicator for MT4 Works
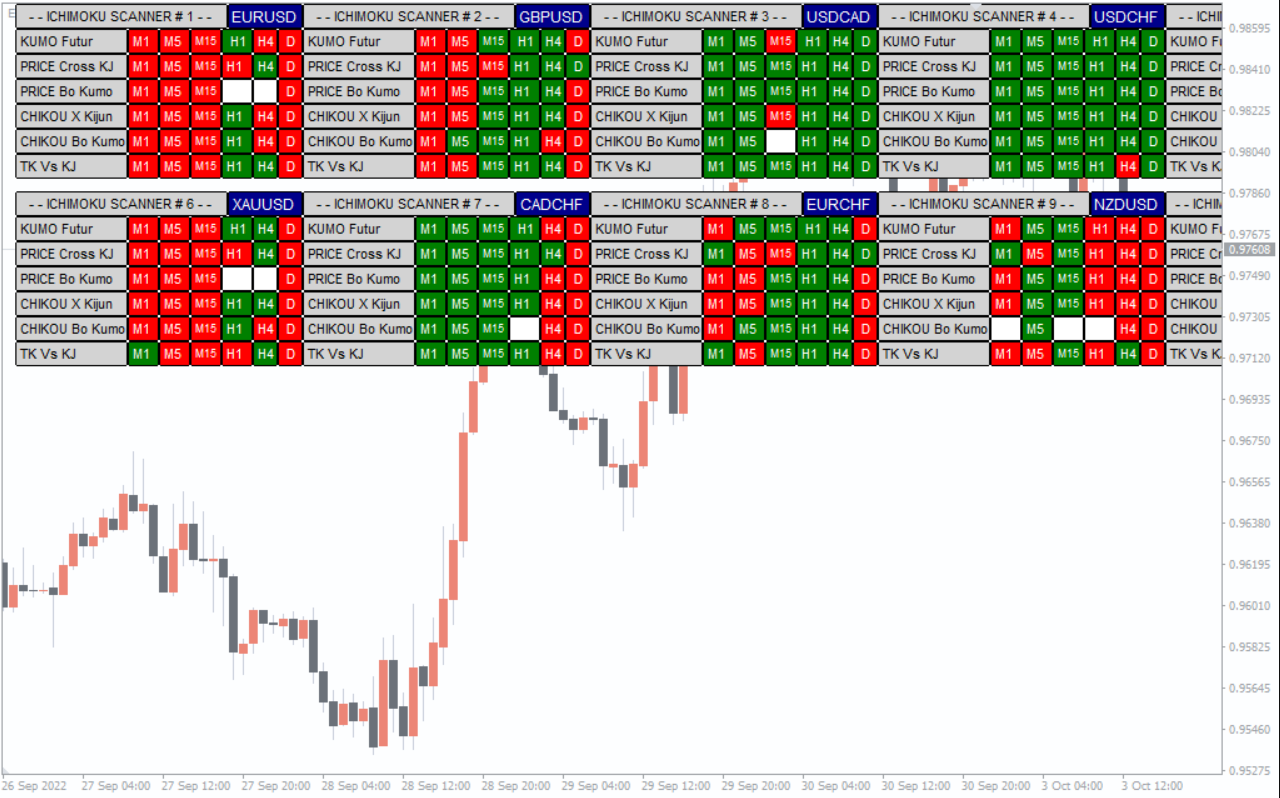
The indicator uses a built-in algorithm to analyze multiple Ichimoku elements on several timeframes at once. The results are displayed in a color-coded dashboard with green and red signals showing the direction of each component.
Multi-Pair and Multi-Timeframe Analysis
The scanner allows traders to:
Monitor up to 10 currency pairs
Scan multiple timeframes simultaneously
Identify trend direction, breakouts, and crossovers
Spot early Ichimoku signals with minimal chart switching
This dramatically reduces the time required for analysis and helps traders catch high-quality setups faster.
Understanding the Ichimoku Signals Displayed on the Scanner
The dashboard displays multiple columns, each representing a component of the Ichimoku system. The author of the indicator (Steeve Martol) provides the following interpretations:
“KUMO Futur”
Green: Bullish future Kumo
Red: Bearish future Kumo
This shows whether the projected cloud (Senkou Span A and B) signals an upcoming bullish or bearish trend.
“PRICE Cross KJ”
Green: Price is above the Kijun-sen
Red: Price is below the Kijun-sen
A classic equilibrium breakout signal.
“PRICE Bo Kumo”
Green: Price breaks above the cloud
Red: Price breaks below the cloud
One of the strongest Ichimoku breakout signals.
“CHIKOU X Kijun”
Green: Chikou Span is above Kijun-sen
Red: Chikou Span is below Kijun-sen
This indicator checks for confirmation of momentum relative to past price levels.
“CHIKOU Bo Kumo”
Green: Chikou Span is above the Kumo
Red: Chikou Span is below the Kumo
Another confirmation component for strong trend directions.
“TK/KJ”
Green: Tenkan-sen is above Kijun-sen (bullish crossover)
Red: Tenkan-sen is below Kijun-sen (bearish crossover)
This is similar to a moving average crossover and often signals early trend changes.
Trading with the Sm Ichimoku Scanner Indicator
Because the scanner processes the full Ichimoku system across pairs and timeframes, traders can:
Identify high-probability breakout conditions
Spot trend reversals early
Filter strong multi-timeframe signals
Avoid weak setups by checking Chikou and Kumo confirmation
A common strategy is to look for full alignment across all components (all green for bullish or all red for bearish). This ensures the trend is strong across all Ichimoku elements.
The scanner works perfectly on MT4 and provides instant visual updates without slowing down the platform.
Benefits of the Sm Ichimoku Scanner Indicator for MT4
Time-Saving
Instead of analyzing each pair manually, traders can scan 10 markets in seconds.
Perfect for Intraday Traders
Scalpers and day traders benefit from rapid signal detection.
Beginner-Friendly
The color-coded dashboard makes Ichimoku trading much easier to understand.
Real-Time Updates
Signals change instantly based on live market prices.
Ideal for Multi-Timeframe Trading
You can track Ichimoku signals from M1 to Daily charts simultaneously.
Conclusion
The Sm Ichimoku Scanner Indicator for MT4 is an exceptional tool for traders who use the Ichimoku trading system. By scanning 10 different currency pairs across various timeframes, it eliminates the need for manual analysis and helps traders identify strong Ichimoku setups with ease.
To access more MT4 and MT5 indicators, visit IndicatorForest.com and explore a complete collection of trading tools.
FAQ
8 Downloads
Published:
Dec 12, 2025 09:16 AM
Category: