The SMA Crossover Indicator for MT4 is a reliable trend-following trading tool that helps traders spot changes in market direction early. It works perfectly on forex, stocks, and cryptocurrency charts, allowing you to assess current market bias with precision.
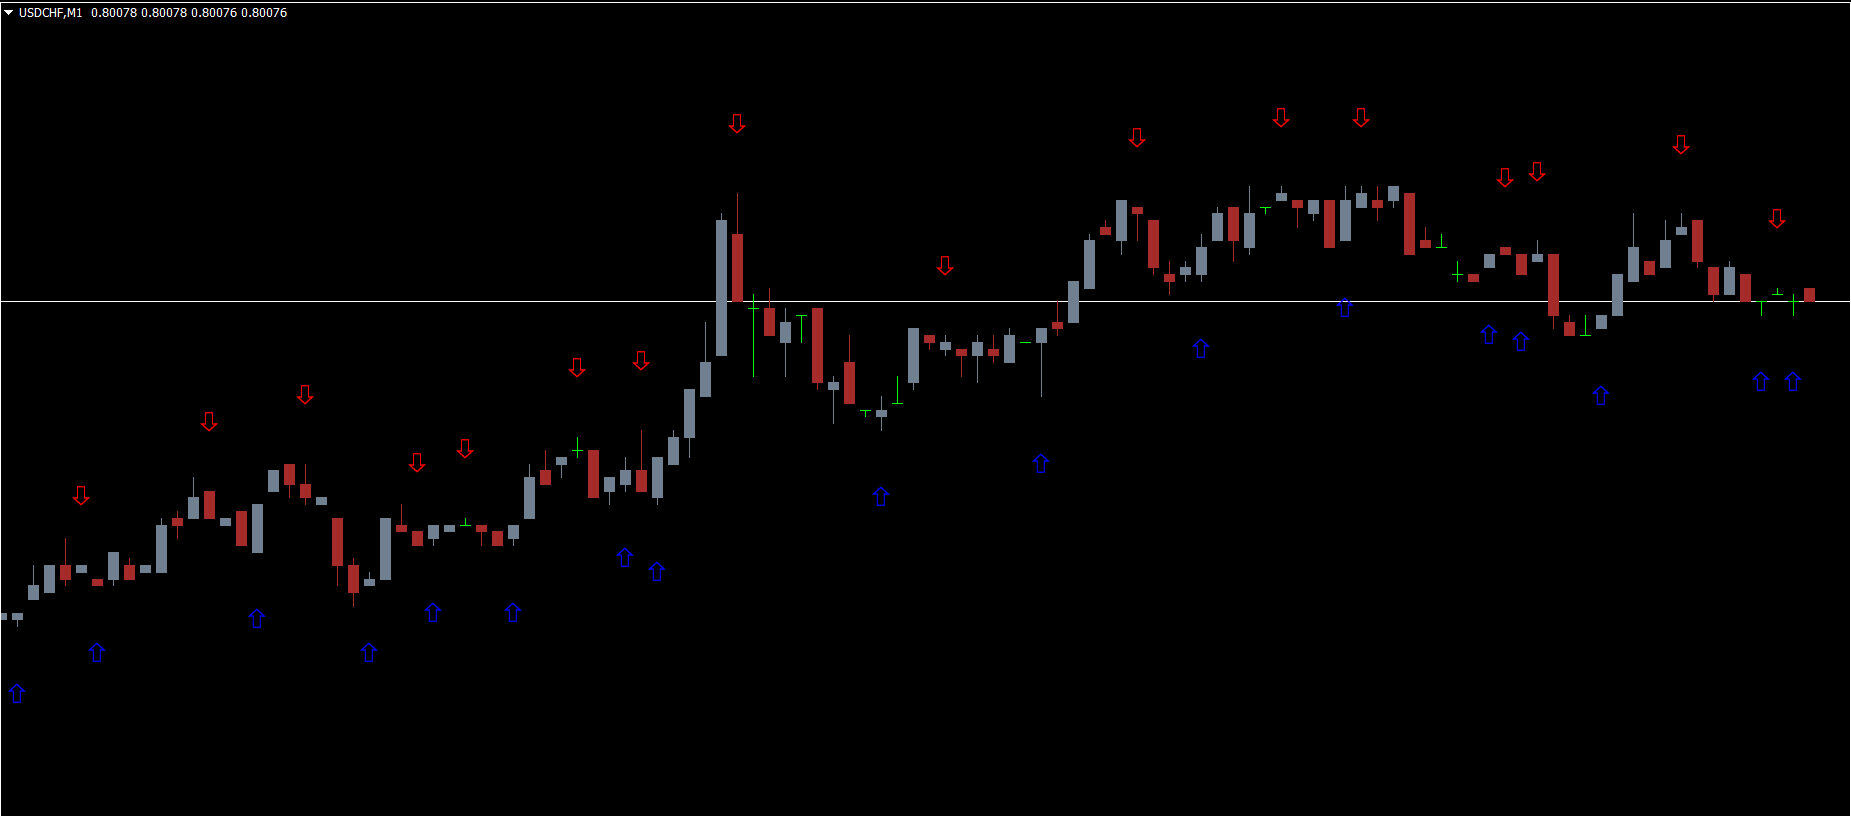
This indicator plots two simple moving averages (SMAs) — one fast and one slow. Whenever the fast SMA crosses above or below the slow SMA, the indicator automatically displays blue or red arrows on the chart. These visual arrows clearly mark bullish and bearish crossover signals, helping traders make quick and confident trading decisions.
How the SMA Crossover Indicator Works
The SMA crossover strategy uses the relationship between short-term and long-term moving averages to define the direction of the trend.
A blue arrow appears when the fast SMA crosses above the slow SMA — signaling a potential BUY setup.
A red arrow appears when the fast SMA crosses below the slow SMA — signaling a SELL opportunity.
By default, the indicator uses 1-period and 34-period SMAs, but you can easily adjust these parameters to suit your trading style.
Shorter periods = more signals (for Scalping/intraday)
Longer periods = fewer but more reliable signals (for swing trading)
How to Trade Using the SMA Crossover Indicator
Buy Setup (Bullish Signal):
Wait for a blue arrow — indicating the fast SMA has crossed above the slow SMA.
Confirm the signal with Price Action, such as a breakout above resistance or rejection from a support level.
Open a BUY trade and set a Stop Loss below the recent swing low.
Consider taking profits at the next resistance or after a red arrow appears.
Sell Setup (Bearish Signal):
Wait for a red arrow — showing that the fast SMA has crossed below the slow SMA.
Confirm the signal with a breakdown below support or rejection at resistance.
Open a SELL position and set Stop Loss above the last swing high.
Exit the trade when a blue arrow or opposite signal appears.
Tips for Best Results
Apply the indicator on higher timeframes (H1, H4, D1) to reduce noise.
Combine it with tools like the RSI Indicator, MACD, or Support/Resistance indicators for added confirmation.
Avoid trading during sideways or low-volume markets, as crossover signals may be less accurate.
Conclusion
The SMA Crossover Indicator for MT4 remains one of the most straightforward and effective trend-following tools for all levels of traders. While simple moving averages may react slower than exponential ones, they provide stronger confirmation of trend direction and market bias.
Whether you trade forex, stocks, or crypto, this indicator helps identify trend reversals, entry points, and support/resistance zones — making it a valuable addition to any trading system.
FAQ
37 Downloads
Published:
Nov 11, 2025 21:13 PM
Category: