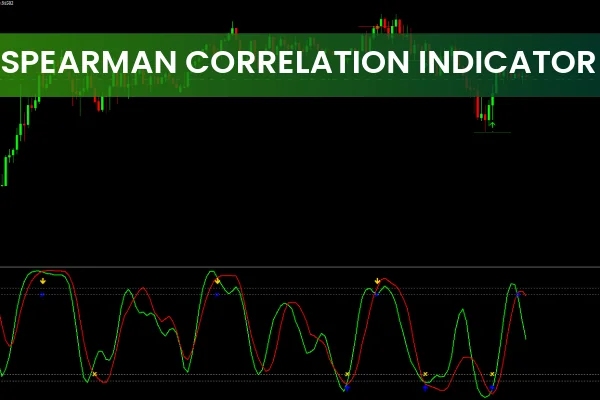
The Spearman Correlation Indicator is a highly effective tool for detecting trend reversals and highlighting extreme price zones where a market is likely to change direction. Based on the Spearman correlation principle, it analyzes previous highs and lows to determine areas of potential Trend Strength and reversal.
The indicator features oscillating lines, price bars, and signal arrows, helping traders clearly identify BUY and SELL opportunities.
How the Spearman Correlation Indicator Works
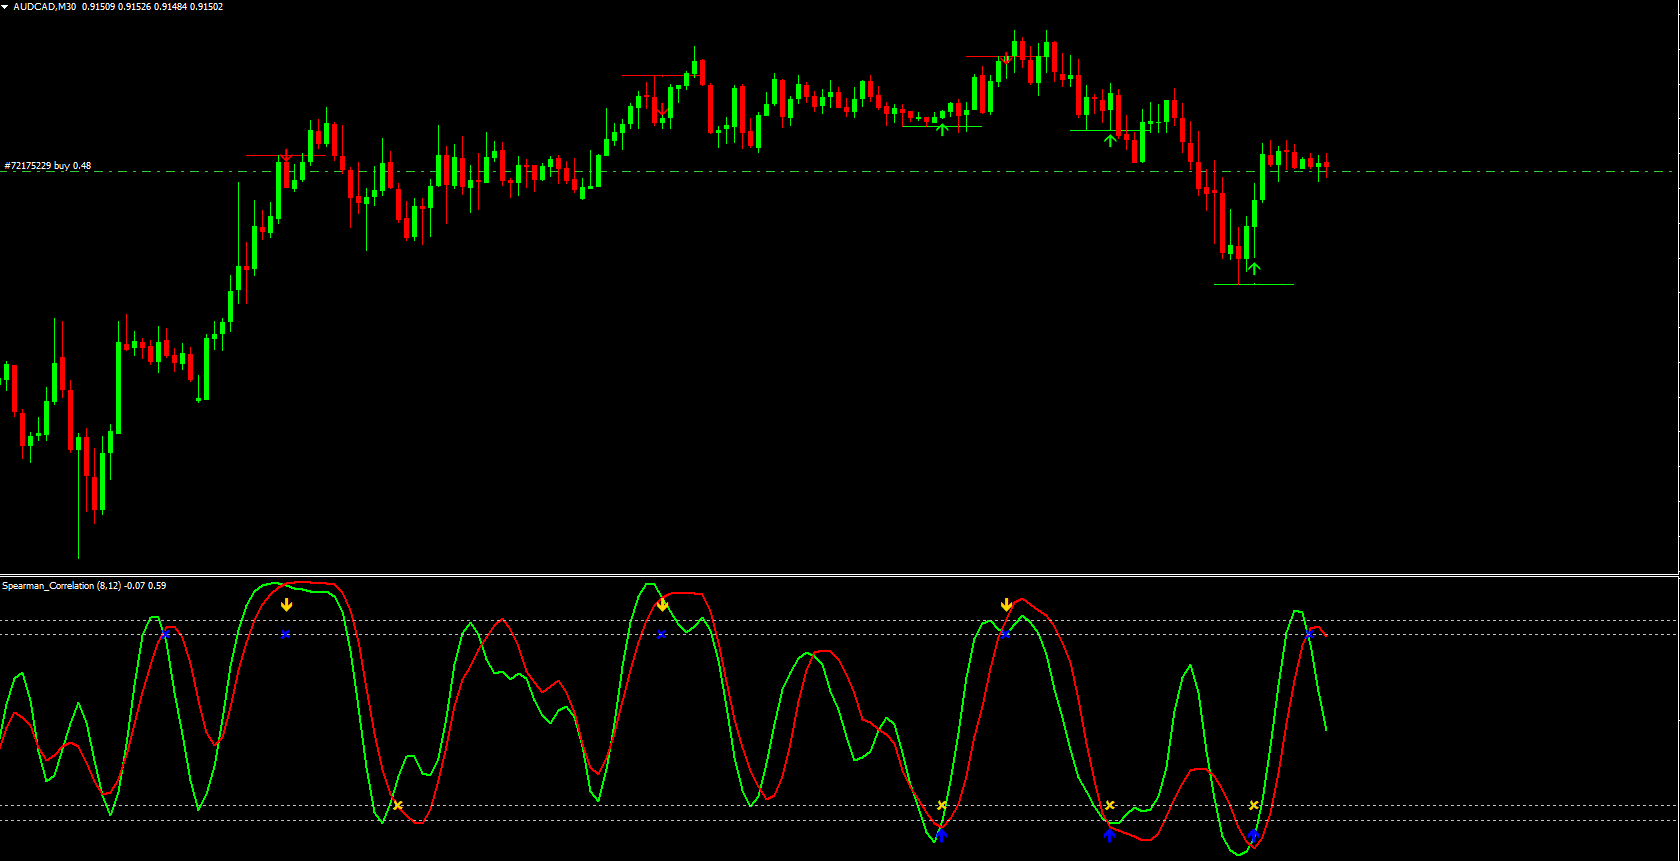
The indicator includes:
Two oscillating lines for overbought and oversold zones
Price bars that change color to indicate trend direction
Signal arrows for possible BUY/SELL entries and trend reversals
It is highly responsive, nearly lag-free, and works best in trending markets. The indicator is suitable for all levels of traders and supports various trading styles such as Scalping, intraday, and swing trading.
Trading Signals Using Spearman Correlation Indicator
BUY Signal
Ensure the market is in an uptrend
Wait for a lime-colored price bar
Observe the two lines interacting with the oversold zone, then crossing upward
Enter a BUY/LONG position when a blue arrow appears on the chart
SELL Signal
Ensure the market is in a downtrend
Wait for a red-colored price bar
Observe the two lines interacting with the overbought zone, then crossing downward
Enter a SELL/SHORT position when a red arrow appears on the chart
By combining trend direction, extreme zones, and signal arrows, traders can confidently identify high-probability trade setups.
Advantages of the Spearman Correlation Indicator
Highlights trend reversal zones with precision
Offers visual BUY and SELL signals through arrows and price bar colors
Highly responsive and almost lag-free
Suitable for scalping, intraday, and swing trading
Free to download and easy to install on MT4
This combination of accuracy and visual clarity makes the Spearman Correlation Indicator a versatile tool for forex traders seeking better trade timing and risk management.
Conclusion
The Spearman Correlation Indicator for MT4 is an excellent tool for trading price reversals and maximizing trend-following opportunities. With its clear signal arrows, oscillating lines, and price bar colors, it allows traders of all experience levels to make precise entries and exits. Download the indicator for free today at IndicatorForest.com and enhance your Trend Reversal strategies.
FAQ
17 Downloads
Published:
Nov 30, 2025 01:12 AM
Category: