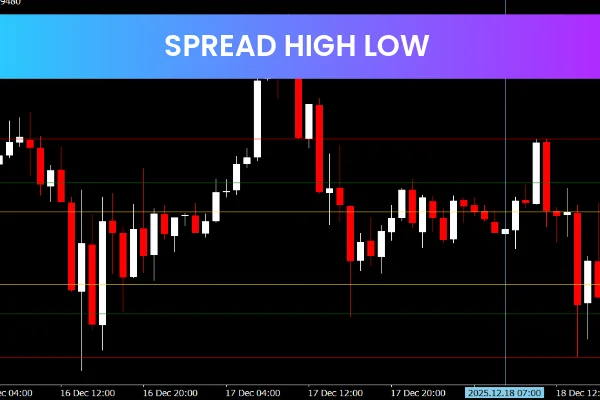
The Spread High Low Indicator is a popular and free Forex Indicator for the MT4 platform. It is designed to help traders measure the difference between the high and low prices of a security over a specific period. By displaying this information as a histogram in a separate window, the indicator provides a clear visual representation of price volatility and market activity.
This tool is especially useful for traders who want to analyze price ranges, spot potential trading opportunities, and make informed decisions on entry and exit points. Its simplicity and visual clarity make it suitable for traders of all experience levels.
Understanding the Spread High Low Indicator
The Spread High Low Indicator calculates the difference between the high and low prices of a security for a given time period. This calculation is plotted as a histogram below the chart, showing fluctuations in price range over time.
Traders can use this information to:
Identify periods of high or low volatility
Spot potential breakout points
Recognize narrowing spreads that may precede a price movement
By tracking the spread signal between the high and low prices, traders can gain insight into market momentum and potential trend reversals.
How the Indicator Works
The Spread High Low Indicator operates by measuring the high-low spread for each candle and plotting it on a histogram.
Histogram and Spread Analysis
Taller bars indicate a larger spread, signaling higher volatility
Shorter bars indicate a smaller spread, signaling lower volatility
Changes in the histogram may suggest potential entry or exit opportunities
This visual representation allows traders to quickly assess the market environment without performing manual calculations.
Customizable Settings
The indicator can be customized to adjust the period length for spread calculation and the color of the histogram. This flexibility allows traders to adapt it to different trading styles and timeframes.
Identifying Entry and Exit Points
Traders commonly use the Spread High Low Indicator to:
Enter trades when the spread increases significantly, indicating strong momentum
Exit trades when the spread decreases, signaling consolidation or potential reversal
Identify breakout opportunities when spread patterns change suddenly
Using these signals alongside other indicators can help traders improve the accuracy of their trades.
Key Benefits of the Spread High Low Indicator
Visual Market Analysis
The histogram provides a clear view of market volatility and the range between high and low prices.
Early Warning of Market Moves
By monitoring spread changes, traders can anticipate potential price movements before they occur.
Customizable and Easy to Use
The indicator is simple to set up and can be tailored to suit any trading style.
Suitable for All Traders
Its visual simplicity makes it beginner-friendly, while its analytical value is appreciated by experienced traders.
Combining the Indicator with Other Tools
For better trading decisions, the Spread High Low Indicator can be combined with:
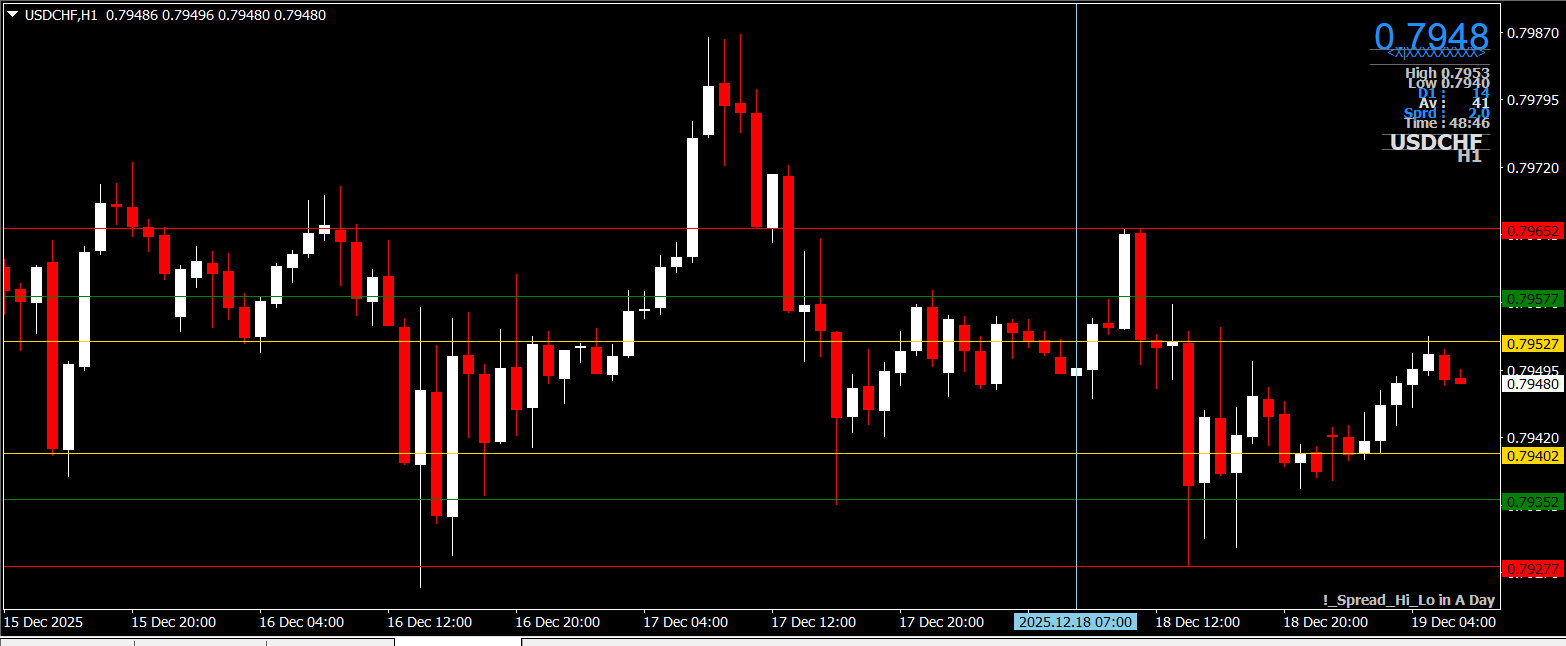
Support And Resistance levels
Trend indicators such as Moving Averages
Price Action patterns
Risk management strategies
This combination enhances trade confirmation and reduces false signals.
Why the Spread High Low Indicator Is Popular
The Spread High Low Indicator is widely used because it provides an easy-to-understand measurement of market volatility. By highlighting the difference between high and low prices, it helps traders identify key trading opportunities efficiently.
For more free and professional MT4 Forex indicators, visit IndicatorForest.com and explore tools designed to improve market analysis and trading performance.
FAQ
Published:
Dec 19, 2025 01:17 AM
Category: