Precision Filtering: Trading Market Cycles with the Stoch Cross CCI Indicator
In modern financial markets, relying on a single technical indicator to determine your trading entries often leads to a barrage of false signals. Oscillators like the Stochastic Indicator excel at identifying overbought and oversold conditions during range-bound conditions but struggle heavily during strong trending markets. Conversely, momentum indicators like the Commodity Channel Index (CCI) are exceptional at spotting cyclical breakouts but can lead to late entries if used in isolation. The Stoch Cross CCI Indicator for MT4/MT5 solves this fundamental dilemma by combining these two powerful mathematical frameworks into a synchronized, on-chart visual tool that delivers high-probability Scalping and day trading setups.
Decoding the Dual-Engine Signal Framework
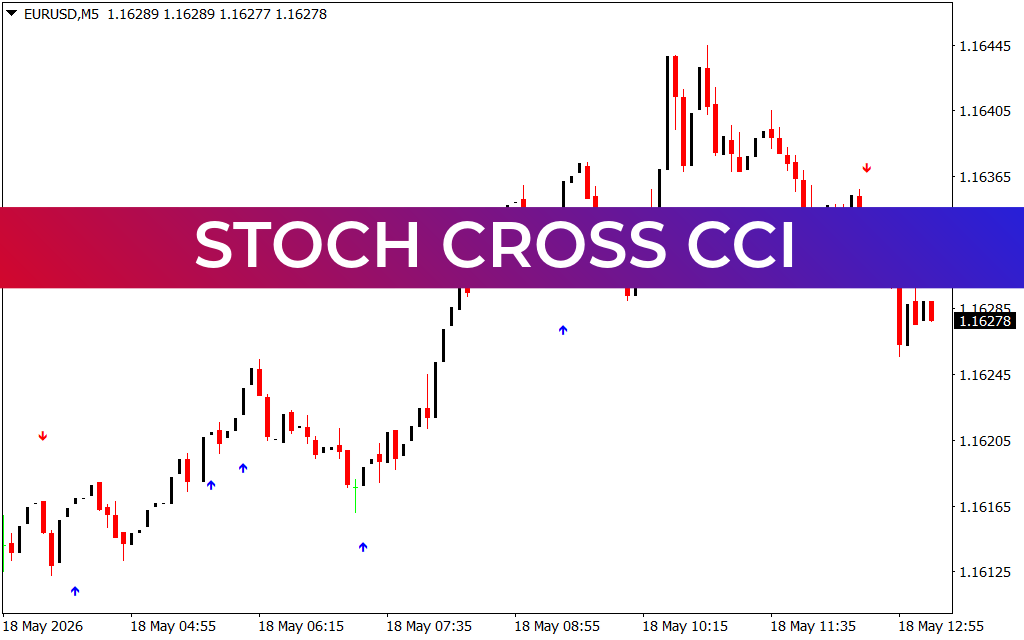
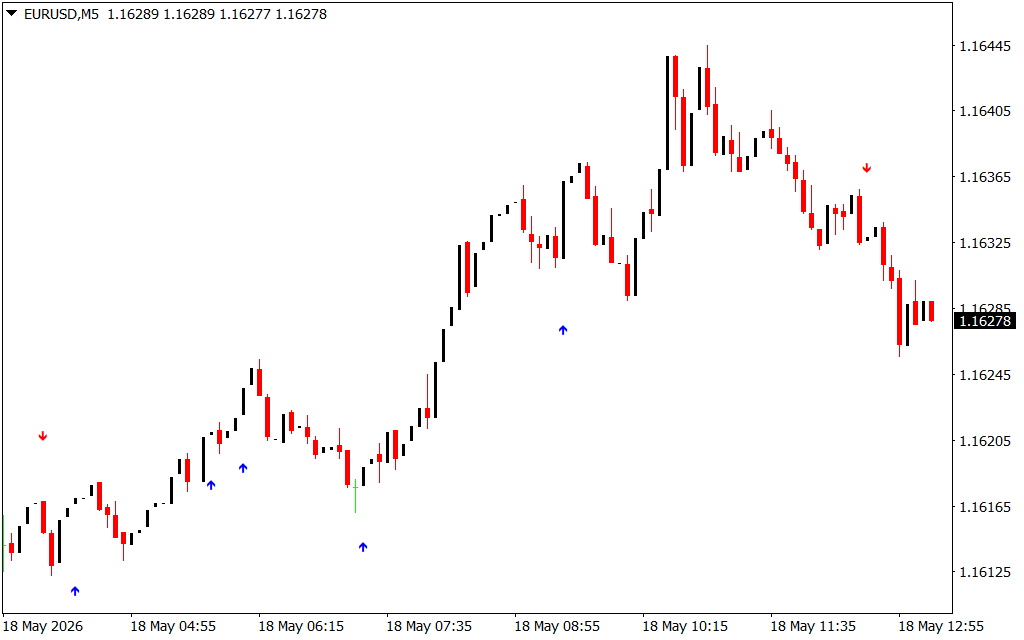
The provided EUR/USD charts—across both the 30-minute (M30) and 5-minute (M5) timeframes—perfectly highlight how the Stoch Cross CCI indicator cuts through market noise to isolate critical pivot zones. By calculating the exact moment a Stochastic crossover aligns with a structural CCI cycle shift, the indicator prints crisp blue (buy) and red (sell) directional execution arrows directly onto the price field.
Looking at the multi-day macro structure on the M30 chart, the pair suffered a heavy markdown phase starting on May 14. During an aggressive downtrend, buying standard oversold signals is highly dangerous. The Stoch Cross CCI indicator manages this risk by requiring both indicators to confirm structural exhaustion. Notice how it filters out the minor pullbacks, printing a highly accurate blue entry arrow at the absolute bottom of the cycle near 1.16110 on May 18, signaling that institutional accumulation is complete.
High-Frequency Execution and Trend Alignment
Moving down to the lower-interval M5 workspace, the practical power of the Stoch Cross CCI indicator becomes immediately apparent for intra-day scalpers. Lower timeframes are notorious for false breakouts, but this dual-filtering system ensures that entries are only triggered when true underlying momentum is accelerating.
As the morning session of May 18 gets underway, the pair builds a steady upward trajectory out of its consolidation floor. The indicator prints successive blue arrows near the 1.16165 and 1.16205 structural zones. These signals confirm that the immediate Stochastic momentum has crossed upward while the CCI line has broken out of its neutral channel, giving scalpers the confidence to ride the vertical expansion phase all the way up toward the 1.16445 peak.
Risk management with the Stoch Cross CCI indicator is exceptionally straightforward. Because the signals print precisely at cyclical turning points, traders can establish tight invalidation levels just below the local swing low. As the market reaches distribution levels later in the session—evidenced by the red sell arrow printing near the 1.16365 breakdown level—traders can cleanly exit long positions or initiate short counter-trend scalps. By merging momentum and cycle synchronization, this indicator provides the absolute clarity required to master short-term order flow.
2 Downloads
Last Update:
May 18, 2026 16:17 PM
Published:
Jan 20, 2026 14:39 PM
Category: