Filtering Intraday Squeezes: Precision Momentum Trading with the Stoch Trend ST Indicator
In the fast-paced environment of lower-timeframe day trading, retail scalpers frequently run into technical roadblocks when relying on classical momentum oscillators. Standard tools like the traditional Stochastic Oscillator perform beautifully when an asset exhibits clear, rhythmic cyclical swings, but they break down during prolonged institutional trend legs or low-volatility consolidation. In a powerful market expansion, traditional oscillators stay pinned in overbought or oversold territories for extended periods, triggering premature counter-trend signals. The Stoch Trend ST Indicator for MT4/MT5 completely updates this dynamic, wrapping advanced structural smoothing into a clean, dual-line sub-window engine designed to capture major momentum expansions while completely filtering out localized noise.
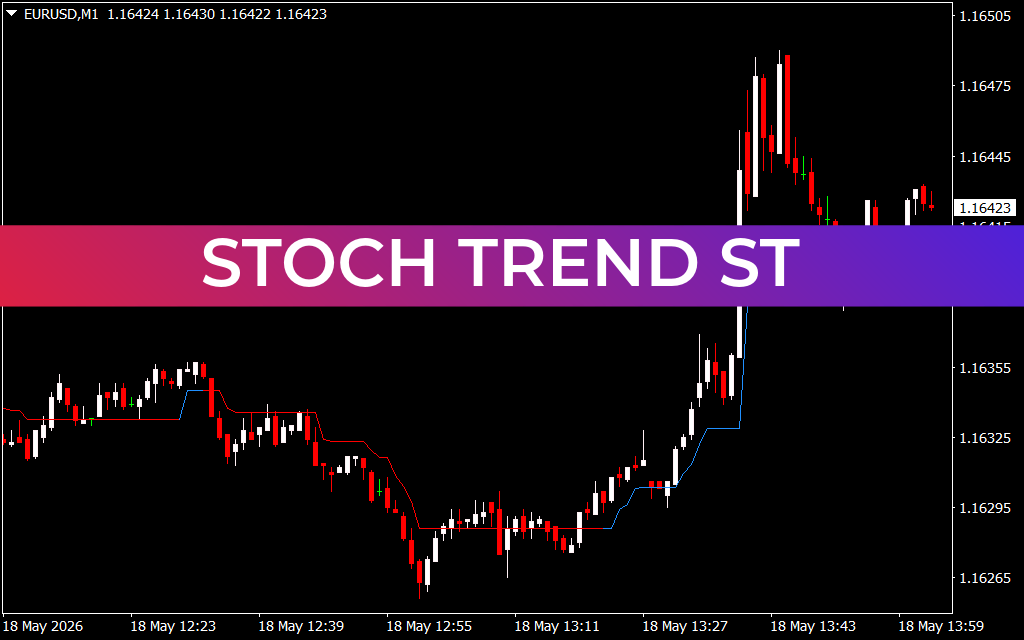
Analyzing the Momentum Cross Matrix on the EUR/USD M5 Chart
The provided EUR/USD 5-minute (M5) chart showcases the profound structural clarity this technical tool introduces to rapid intra-day workspaces. Positioned in the indicator sub-window directly beneath the price field, the Stoch Trend ST engine translates complex mathematical pricing data into two highly responsive, color-coded lines—one green and one red—oscillating smoothly between precise upper and lower boundary thresholds.
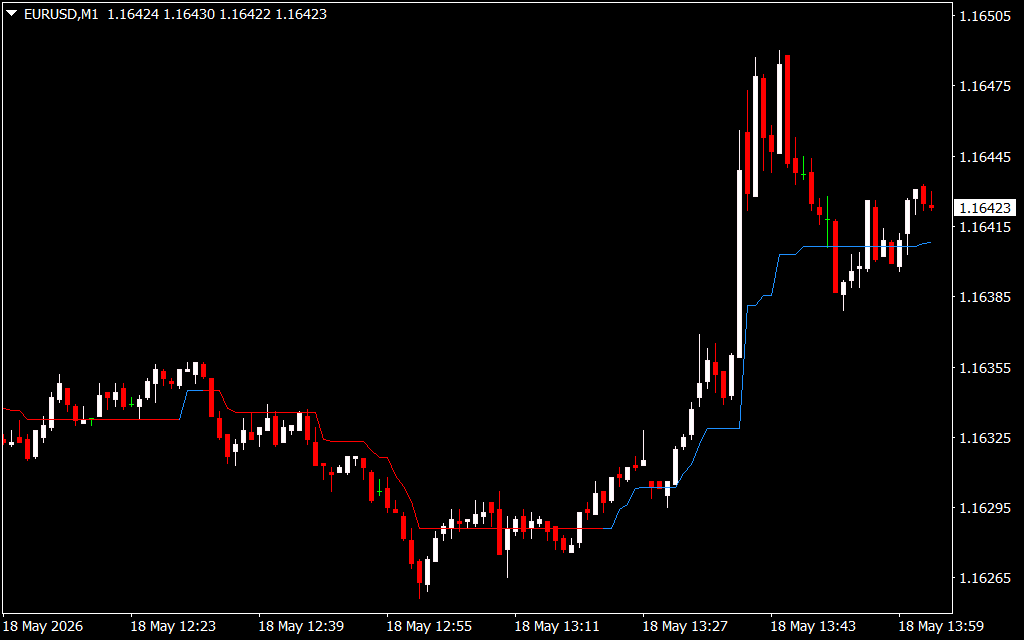
During the early morning session of May 18, the currency pair entered a tight consolidation phase near the 1.16135 liquidity floor. In standard indicator configurations, choppy sideways price movement triggers dozens of micro-crossovers, causing retail accounts to get chopped up.
Notice how the Stoch Trend ST line matrix handles this compression zone: the two lines run entirely flat and tightly intertwined, signaling a lack of real market expansion. The definitive tradeable trigger materializes near the 07:40 session marker as the green line breaks decisively above the red line, surging vertically out of the lower oversold boundary. This clear visual crossover confirms that institutional accumulation is complete, fueling a massive structural markup wave that pushed the asset cleanly past 1.16375.
Capitalizing on Trend Extensions and Volatility Exhaustion
The true strategic edge of the Stoch Trend ST indicator lies in its unique ability to hold a trend direction during massive vertical runs without generating lagging or erratic signals. As the EUR/USD upward momentum accelerated toward its peak, the indicator lines sustained an aggressive, parallel trajectory upward, providing day traders with the confidence to stay in the position and trail their stop-losses safely below local structural swings.
Following a massive expansion that peaked near 1.16435, the asset entered an institutional distribution phase. The indicator precisely caught this trend rotation: the lines formed a clean mathematical dome at the upper threshold before crossing downward, providing an early warning that the immediate buying velocity had completely dried up.
Currently trading near 1.16297, the indicator lines have flattened near the lower baseline, signaling that the localized markdown wave is stabilizing. By integrating the Stoch Trend ST indicator into your daily MetaTrader workspace, you move away from chaotic lagging indicators and adopt a professional, rule-based momentum filter that optimizes execution speed and sharpens risk management.
2 Downloads
Last Update:
May 18, 2026 17:04 PM
Published:
Jan 19, 2026 21:04 PM
Category: