Master Trend Velocity with the Strength Indicator V1
In the fast-paced landscape of financial trading, trading against institutional volume is an easy way to deplete a capital account. Many technical traders fail not because they miss a trend, but because they enter a weak, late-stage market expansion just as it prepares to reverse. Distinguishing between an active, high-velocity rally and a low-volume, choppy consolidation phase requires objective measurement. The Strength Indicator V1 resolves this core issue by acting as an automated mathematical compass that isolates and displays true trend intensity.
By calculating volume distributions below your primary chart workspace, this tool helps traders execute rules-based strategies with complete statistical clarity.
The Advantage of Dual Moving Average Smoothing
When tracking liquid assets like the EUR/USD on intermediate timeframes, such as the 30-minute (M30) interval, raw candlestick patterns can easily mask underlying exhaustion. The Strength Indicator V1 clears away this visual confusion by utilizing a sophisticated dual moving average engine.
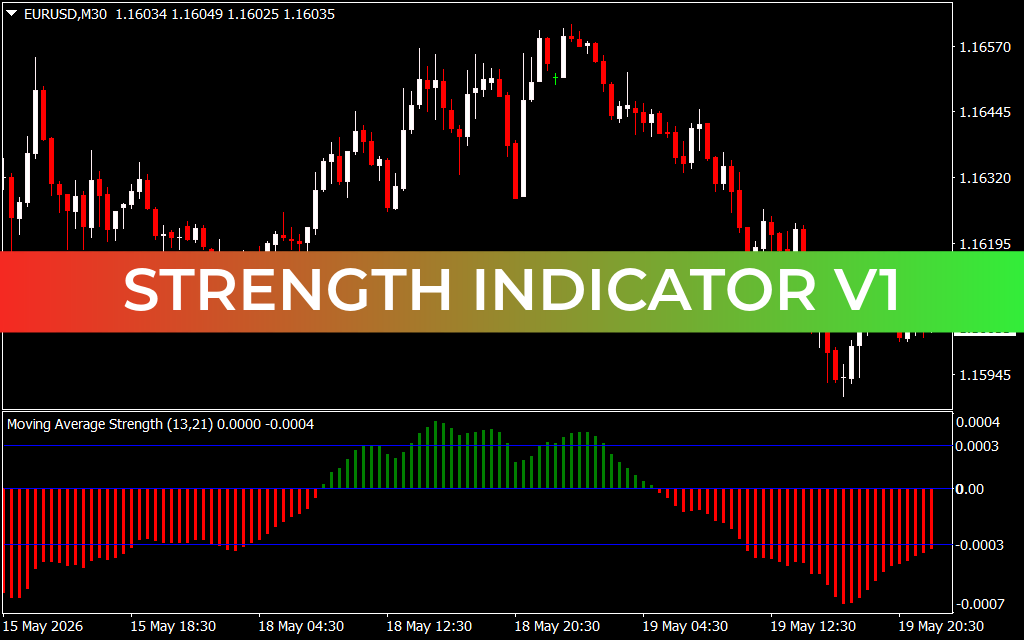
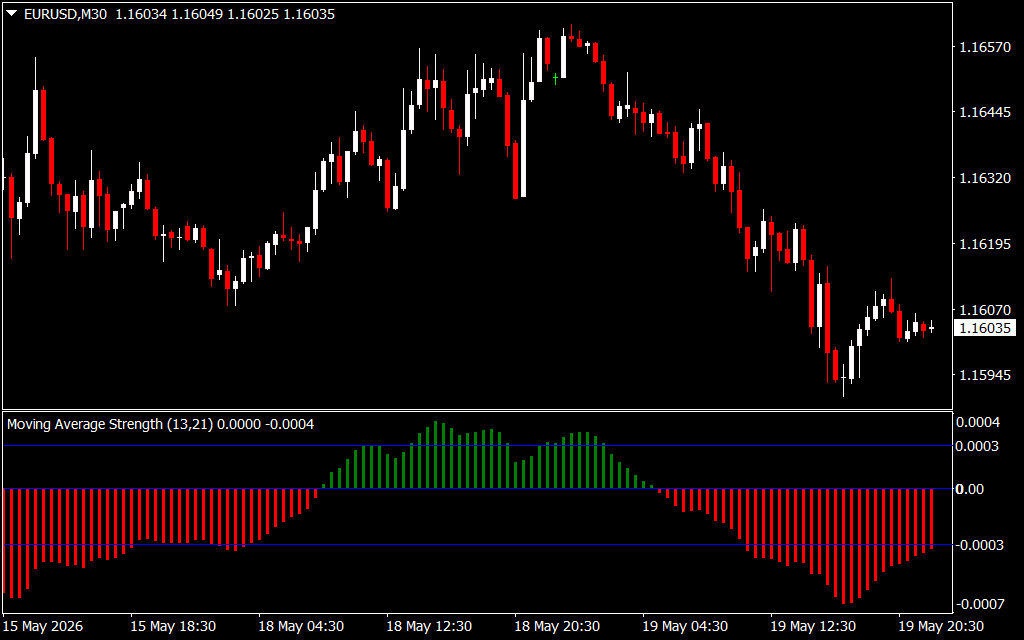
As showcased in platform setups like the Moving Average Strength (13, 21) profile, the software processes data through a dedicated histogram window, translating momentum into clear visual benchmarks:
- Sustained Bullish Velocity (Green Bars): When the fast moving average safely crosses above the slower baseline, the indicator prints bright green histogram bars above the central 0.00 line. This acts as a clear visual green light for trend-continuation and breakout setups.
- Aggressive Bearish Velocity (Red Bars): Conversely, when intense institutional distribution drives Price Action downward, the histogram shifts below the zero axis, painting red bars. This warns day traders to instantly halt buy configurations and pivot strictly to short positions.
- Fixed Volatility Thresholds: Equipped with upper and lower boundary lines mapped at 0.0003 and -0.0003, the sub-window highlights extreme, overextended momentum points where local pullbacks or profit-taking cycles are mathematically expected.
Implementing Rule-Based Trading Strategies
Integrating the structural mechanics of the Strength Indicator V1 into your morning routine removes guesswork, delivering an objective execution blueprint.
1. Capturing Early Cycle Crosses
The absolute zero line (0.00) serves as the core equilibrium axis between buyers and sellers. When a cluster of red momentum bars contracts upward and breaks decisively above the zero baseline into a green bar, it signals that true buying strength has returned to the asset. This crossover point offers an incredibly early entry into emerging bullish legs.
2. Spotting Volume Exhaustion at Peak Levels
When a trend accelerates rapidly, the histogram bars will expand until they reach or breach the outer horizontal threshold lines. If the bars peak at these extremes and then begin to shorten, it alerts the technical analyst to a sharp reduction in market velocity—marking an ideal exit window to lock in profits before a retracement unfolds.
Conclusion
The Strength Indicator V1 is an invaluable charting upgrade for technical day traders and swing traders alike. By filtering out structural market noise and measuring the exact momentum behind price action, it ensures you remain aligned with dominant institutional order flow. Download the Strength Indicator V1 today to optimize your MetaTrader platform and trade with systematic precision.
3 Downloads
Last Update:
May 20, 2026 01:56 AM
Published:
Jan 19, 2026 11:16 AM
Category: