Streamlining Market Timing with the Super Signals Indicator for MT4
Pinpointing the exact moment a market trend reverses is one of the greatest challenges in forex trading. While many technical tools overlay complex mathematical equations across Price Action, the Super Signals indicator for MetaTrader 4 (MT4) focuses on simplicity. Built explicitly to highlight potential swing highs and swing lows, this popular technical tool helps traders track major exhaustion points in price action without cluttering their workspace.
By translating complex trend and momentum shifts into clean visual cues, it acts as a streamlined filter for day traders and swing traders alike.
Understanding the Super Signals Visual Alerts
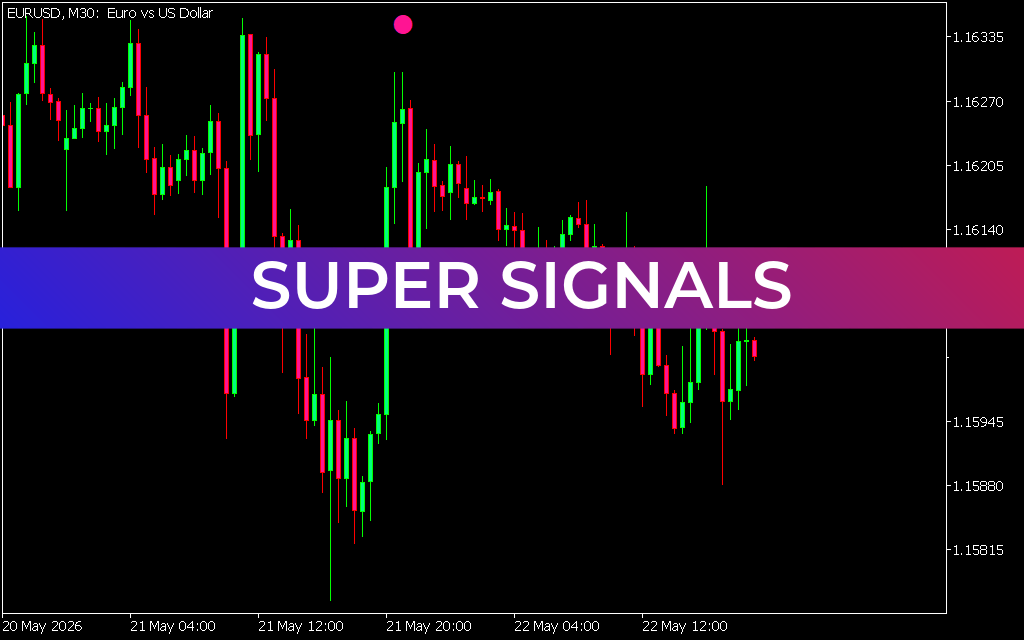
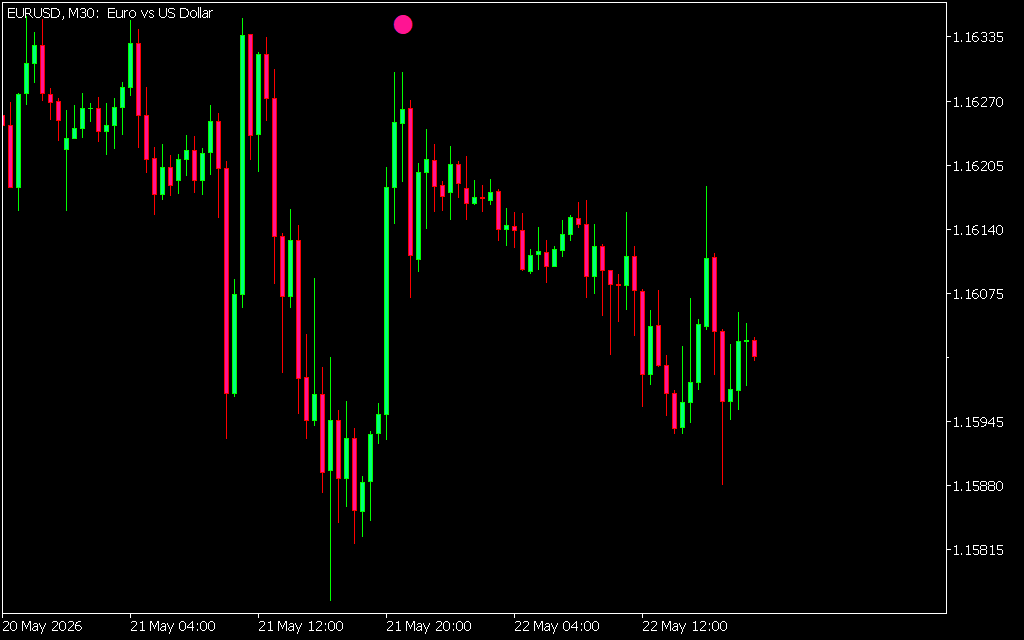
The primary benefit of the Super Signals indicator is its straightforward interface. Rather than tracking intersecting lines or historical histograms, traders monitor automated visual anchor markers placed directly above or below specific price candles.
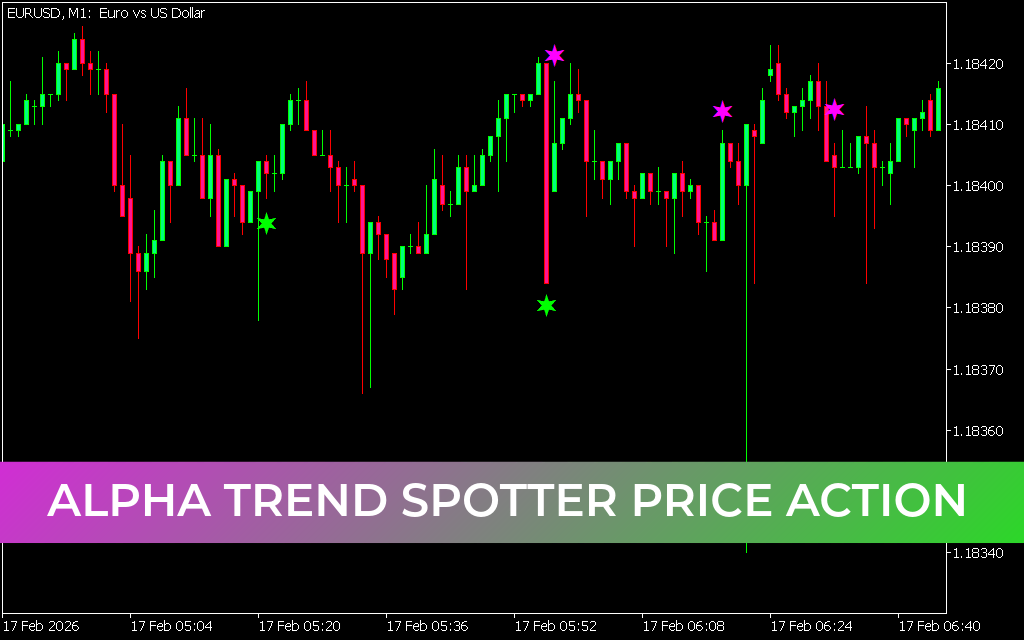
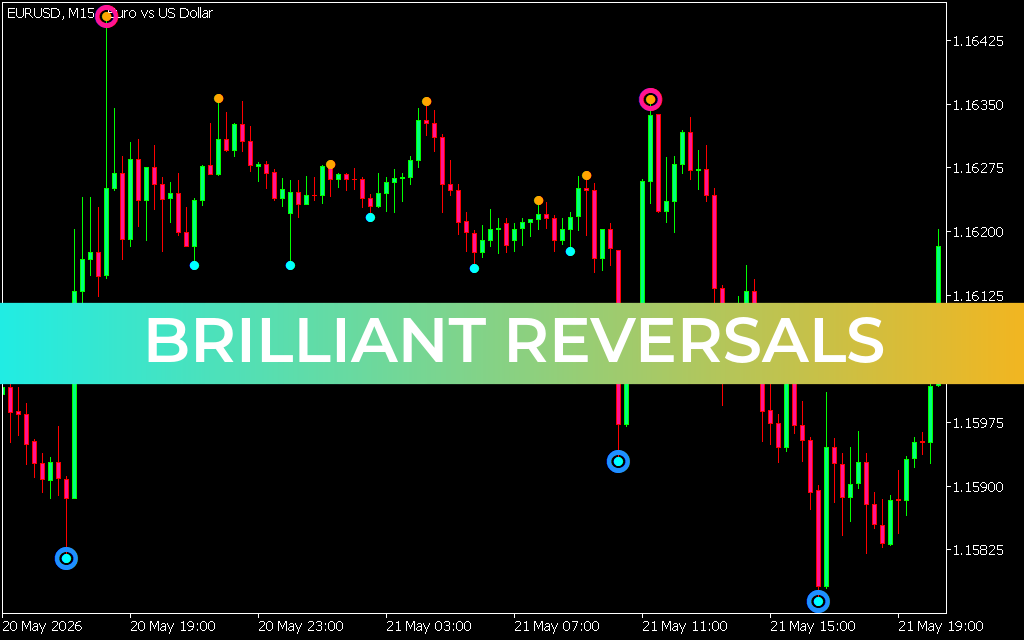
- The Top Signal Dot (Magenta/Pink Circle): This marker automatically plots above a localized price peak. It indicates that upward momentum has hit a temporary exhaustion point or heavy resistance zone, warning traders that a downward reversal may be imminent.
- The Bottom Signal Dot: Conversely, a bottom marker plots below a major price valley, indicating that selling pressure has dried up and buyers are beginning to reclaim control at a support level.
By anchoring these dots to extreme structural pivots on the chart, the indicator gives traders an instant perspective on current overbought or oversold conditions.
How to Trade Using Super Signals
Integrating this tool into an MT4 trading routine relies on clear, mechanical execution rules for managing trend changes.
1. Executing Bearish Setups (Sell Triggers)
When price action climbs rapidly and prints a prominent magenta dot above a candlestick high, it serves as a visual alert that the market is overextended. Traders look for this confirmation near established horizontal resistance lines or key psychological levels to validate a short entry. The presence of the dot signals a prime opportunity to seek downside targets or close out existing long positions.
2. Executing Bullish Setups (Buy Triggers)
When the market undergoes an aggressive sell-off and a signal dot prints directly beneath a swing low, it alerts traders to an oversold structural pivot. This setup suggests that selling momentum is slowing down. Traders use this signal as a foundation to plan long positions, anticipating a corrective bounce or a full Trend Reversal to the upside.
Optimizing the Strategy
To achieve sustained success with the Super Signals indicator, it should be treated as a supportive structural tool rather than a standalone system:
- Incorporate Trend Filters: Avoid taking counter-trend signals blindly. If a higher timeframe (like H4) shows a powerful uptrend, focus primarily on buy signals that appear on lower timeframes like the 30-minute (M30) chart.
- Combine with Price Action: Look for Japanese candlestick reversal patterns, such as pin bars or engulfing candles, that form precisely where the indicator prints a dot.
- Capital Protection: Place stop-loss orders just beyond the wick of the candle that triggered the dot to maintain a highly favorable risk-to-reward ratio.
27 Downloads
Last Update:
May 22, 2026 21:01 PM
Published:
Jan 17, 2026 14:12 PM
Category: