Trade Key Levels with the Support and Resistance Breakout Signals Indicator
Identifying where the market is likely to pause, reverse, or aggressively break through is one of the foundational pillars of profitable technical analysis. While drawing horizontal lines manually is a standard practice, it is often subjective and highly prone to human error. The Support And Resistance Breakout Signals indicator automates this entire process, delivering clear, rule-based key levels alongside real-time entry alerts directly to your trading charts.
Here is an analytical breakdown of how this multi-functional Breakout Indicator works and how to incorporate it into your daily trading routine on platforms like MetaTrader.
What is the Support and Resistance Breakout Signals Indicator?
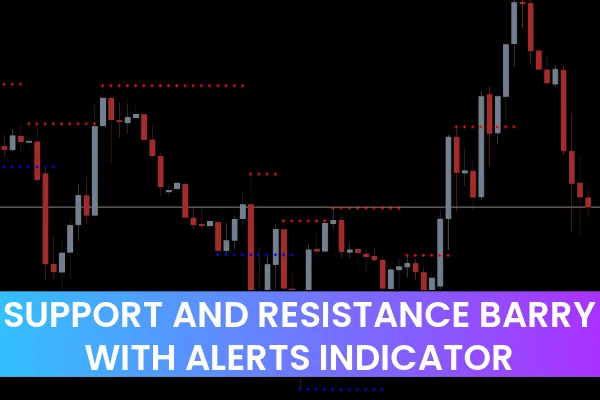
This indicator is an all-in-one technical analysis tool designed to plot dynamic support and resistance zones while automatically tracking market breakouts. It systematically identifies key structural highs and lows over a set look-back period, mapping them out as clear horizontal dot matrices on your main price chart.
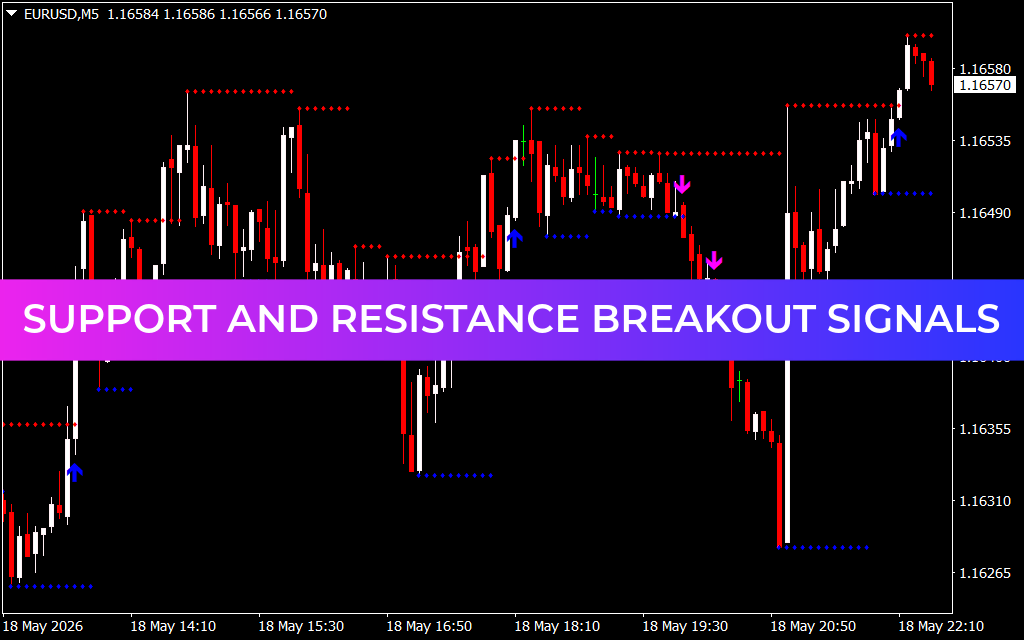
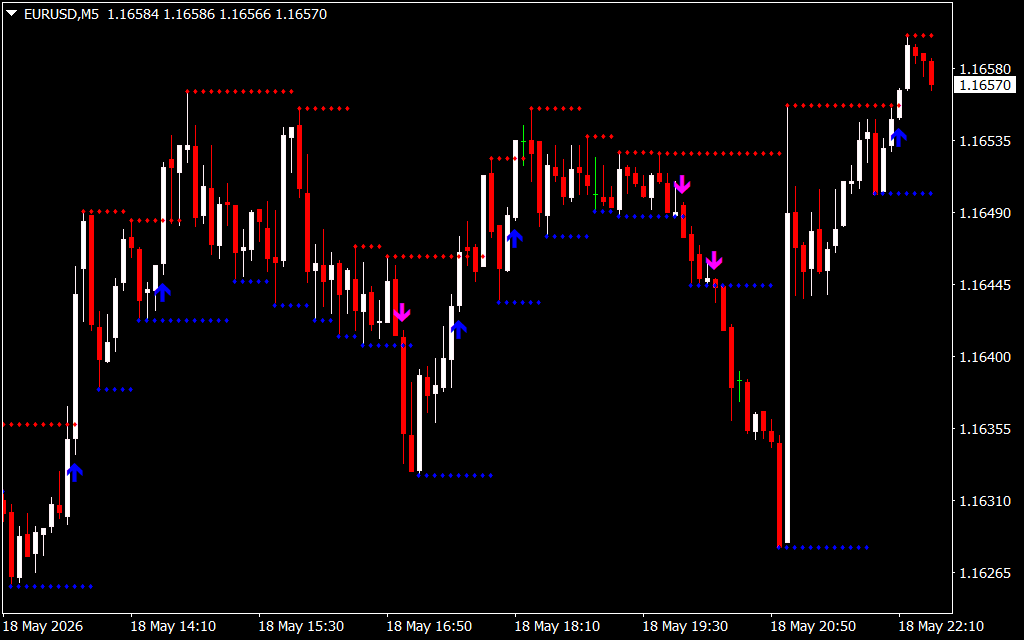
- Red Dotted Lines: Represent structural overhead resistance levels.
- Blue Dotted Lines: Represent underlying market support levels.
As showcased on the EURUSD M5 chart, the indicator does much more than draw lines; it actively prints actionable breakout triggers. When the price breaks decisively through a key level, the indicator prints an arrow to signal immediate momentum: a blue up-arrow denotes a bullish resistance breakout, while a magenta down-arrow highlights a bearish support breakout.
Key Advantages for Breakout and Swing Traders
- Objective Key Levels: It completely eliminates trading subjectivity by using exact Price Action data to plot crucial pivot zones.
- Instant Visual Triggers: The automatic arrow system ensures you never miss an explosive breakout move, even when monitoring multiple asset pairs simultaneously.
- Dynamic Stop-Loss Targets: The blue and red dotted lines double as highly reliable structural zones for placing protective stop-losses or trailing targets.
Strategic Implementation and Trading Rules
To capitalize on the momentum generated by this indicator, traders typically utilize two core strategies:
- The Pure Breakout Play: When a candlestick closes cleanly beyond a red or blue dotted line and a breakout arrow prints, enter a market order in the direction of the arrow. This strategy aims to capture the rapid, volatile expansion that occurs as trapped orders are triggered.
- The Breakout Re-test: For a more conservative entry, wait for a breakout arrow to appear, then pause. Frequently, the price will pull back to re-test the broken level—turning old resistance into new support (or vice-versa). Entering on this re-test gives you a tighter stop-loss and a much higher risk-to-reward ratio.
3 Downloads
Last Update:
May 19, 2026 01:33 AM
Published:
Jan 19, 2026 20:56 PM
Category: