Master Price Action with the Support Resistance Breakout Arrow Indicator
In the world of technical analysis, few concepts are as foundational—and as profitable—as Support And Resistance. These invisible psychological levels represent where buyers and sellers are battling for control. However, identifying these levels in real-time and determining when a true breakout is occurring can be a daunting task for many traders. The Support Resistance Breakout Arrow Indicator for MetaTrader 4 and 5 is designed to automate this process, providing clear, visual signals precisely when the market shifts.
Automating the Foundation of Trading
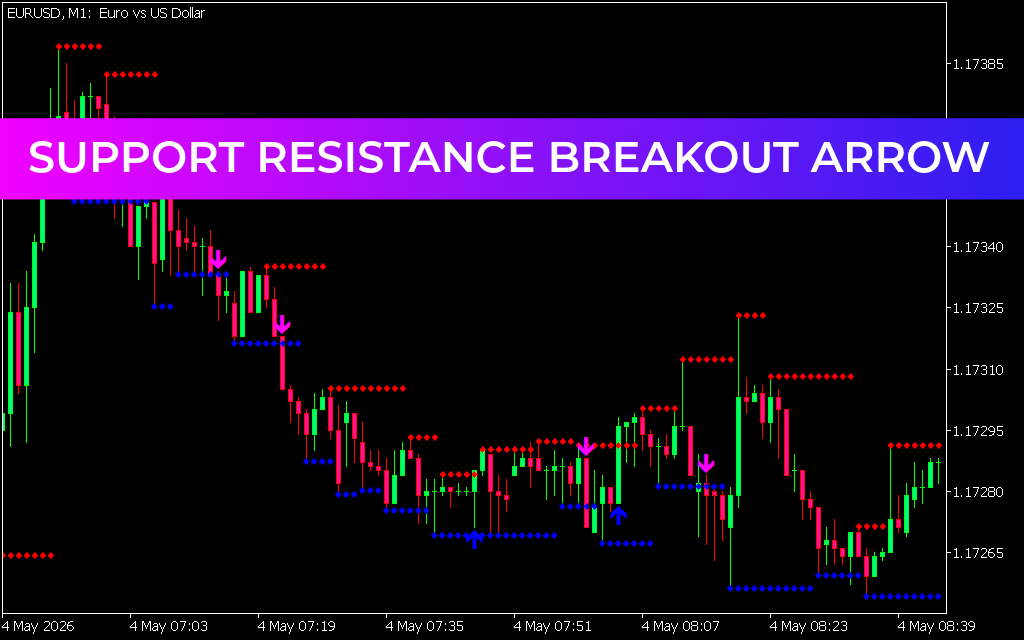
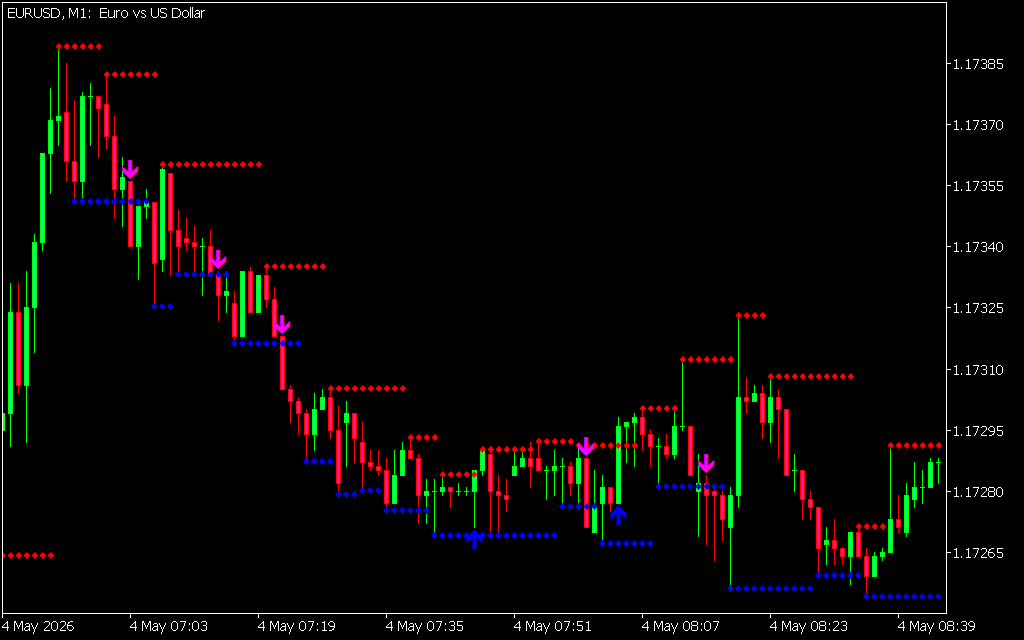
The Support Resistance Breakout Arrow Indicator does the "heavy lifting" for you by scanning historical Price Action to identify significant peaks and troughs. It then projects these as horizontal levels on your chart:
- Resistance Levels (Red Dots): These mark price ceilings where selling pressure has historically overwhelmed buying interest.
- Support Levels (Blue Dots): These represent price floors where buyers have previously stepped in to prevent further declines.
By having these levels automatically plotted, traders can maintain a "clean" chart while staying aware of the key structural zones that will likely influence future price movement.
How the Breakout Arrow Works
The true power of this indicator lies in its signaling mechanism. Instead of simply showing you the lines, it monitors for high-conviction candle closes beyond these zones. When a breakout occurs, the indicator prints a visual cue:
- Bullish Breakout (Blue Up Arrow): This appears when price closes decisively above a resistance level, suggesting that the "ceiling" has been broken and a new uptrend is beginning.
- Bearish Breakout (Magenta Down Arrow): This appears when price closes below a support level, indicating that the "floor" has given way to increased selling pressure.
As seen in the provided EUR/USD M1 chart, these arrows help traders catch rapid momentum shifts immediately as they happen. For scalpers, this timing is the difference between a winning trade and a missed opportunity.
Strategy Integration and Risk Management
While breakouts can be incredibly profitable, they are also prone to "fakeouts"—where price briefly breaks a level only to reverse. The Support Resistance Breakout Arrow Indicator helps mitigate this by requiring a candle close, but professional traders often use additional filters:
- Trend Alignment: Only take buy arrows when the overall higher-timeframe trend is bullish.
- Volume Confirmation: Look for increased tick volume during the breakout candle to ensure institutional backing.
- The Retest: Often, price will break a level and then return to "retest" it. This retest provides a secondary, lower-risk entry point in the direction of the arrow.
Conclusion
The Support Resistance Breakout Arrow Indicator is an essential tool for any price action trader. It removes the subjectivity of manual drawing and replaces it with objective, rule-based signals. Whether you are Scalping the 1-minute charts or swing trading the daily timeframes, this indicator ensures you never miss a critical market turn. Download it today to upgrade your MT4/MT5 platform with institutional-grade breakout detection.
18 Downloads
Last Update:
May 04, 2026 14:36 PM
Published:
Jan 28, 2026 12:26 PM
Category: