The Synergy TDI Indicator for MT4 is one of the most dynamic and versatile trading tools available for MetaTrader. By combining the RSI, Moving Averages, and Bollinger Bands into one visual display, the indicator delivers a complete overview of market momentum, volatility, and Trend Strength. Traders who want a clearer picture of market sentiment often choose the Synergy TDI because it simplifies analysis and helps identify high-probability setups across major forex pairs and other financial instruments.
The indicator is widely used in scalping, intraday trading, and swing strategies thanks to its multi-functional structure. Because the Synergy TDI summarizes several indicators in one place, it allows traders to interpret Price Action faster and more accurately.
How the Synergy TDI Indicator Works
The Synergy TDI Indicator for MT4 is built around the classic RSI, which measures momentum. However, instead of displaying the RSI alone, the indicator adds a moving average signal line and Bollinger-style volatility bands. These added components help traders interpret Market Structure in greater detail.
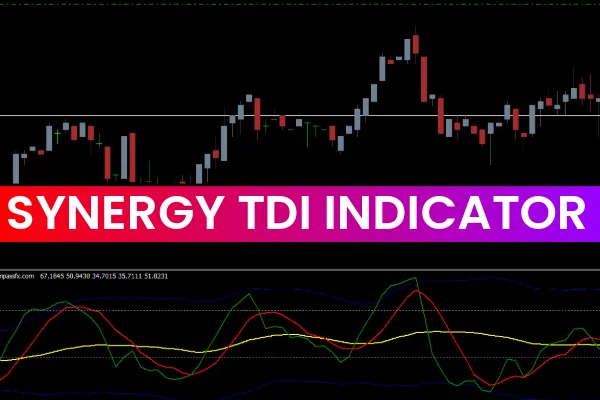
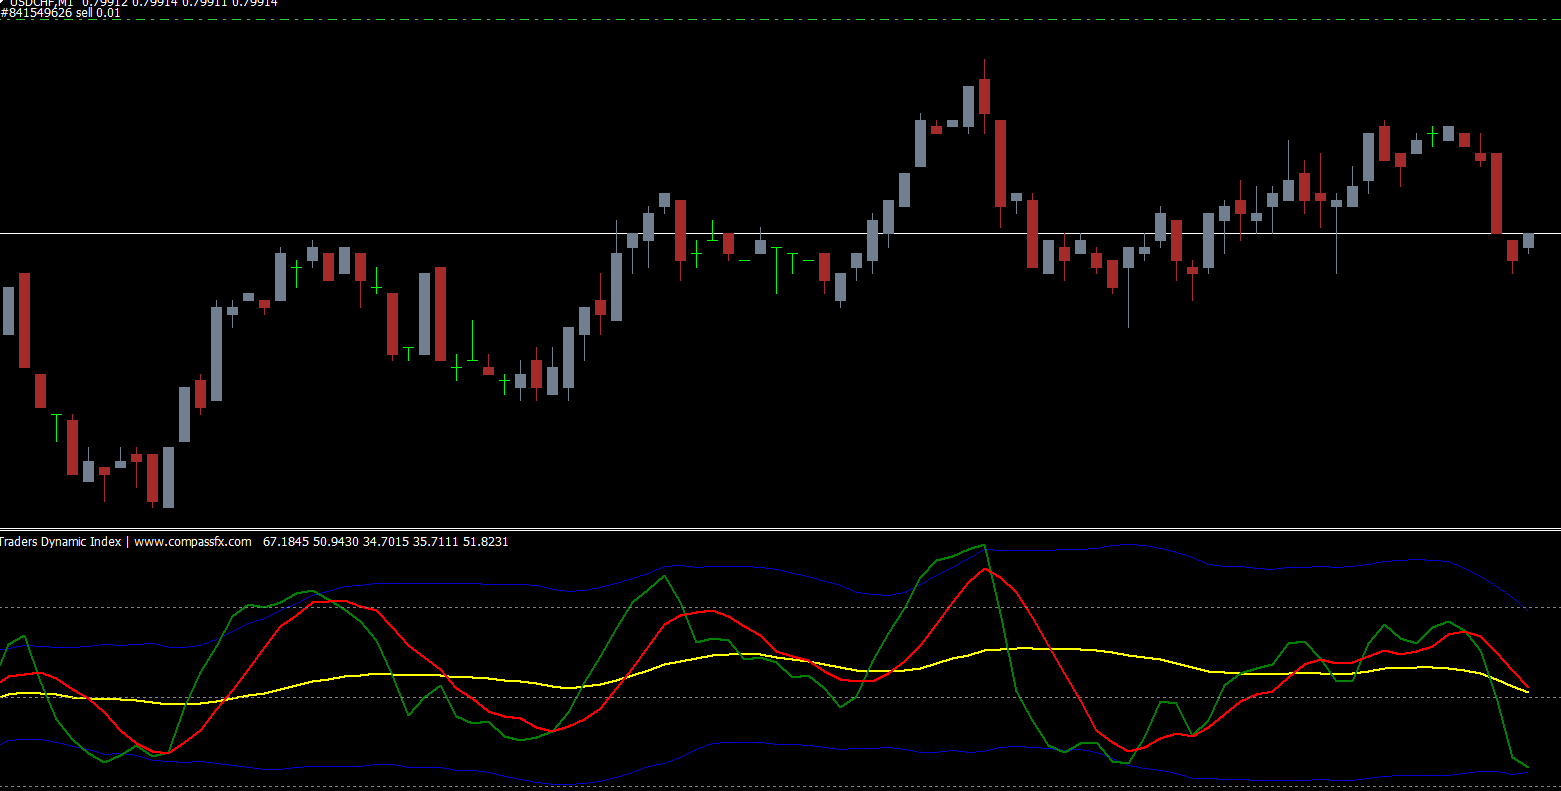
The indicator consists of:
Green Line (RSI Price Line): Shows short-term momentum.
Red Line (Signal Line): A smoothed version of RSI used for crosses.
Yellow Line (Market Baseline): Indicates overall trend direction.
Blue Bands (Volatility Bands): Represent overbought and oversold zones.
This combination offers a balanced view of trend, strength, momentum, and volatility — making it easier to evaluate potential trade entries and exits.
Why the Synergy TDI Indicator for MT4 Is Effective
The Synergy TDI is considered one of the best custom indicators for MT4 because it captures several market conditions at once. Traders can quickly analyze:
Overbought and oversold zones
Momentum changes
Volatility expansion and contraction
Trend direction
Market sentiment
Divergences
M and W pattern reversals
This indicator’s ability to deliver multiple insights makes it suitable for beginners and advanced traders alike.
How to Trade Using the Synergy TDI Indicator
Buy Signal Strategy
Wait for the green RSI line to reach the oversold zone near the lower blue band.
Confirm that the yellow baseline is moving above the 50 level, signaling bullish bias.
Enter a buy trade once both the green line (RSI) and red line (signal) cross above the yellow line.
Set a stop-loss below the previous swing low for risk control.
Sell Signal Strategy
Wait for the green RSI line to reach the overbought zone near the upper blue band.
Confirm that the yellow baseline is moving below the 50 level, signaling bearish sentiment.
Enter a sell trade once both the green and red lines cross below the yellow baseline.
Place a stop-loss above the nearest swing high.
This structured approach helps traders identify high-probability trading opportunities with improved accuracy.
Benefits of Synergy TDI Indicator for MT4
Multi-Indicator View: Combines trend, momentum, and volatility readings in one window.
Easy Visual Signals: Color-coded lines make decision-making easier.
Suitable for All Trading Styles: Works for Scalping, day trading, and swings.
Improved Accuracy: Filters market noise and highlights clearer opportunities.
Beginner-Friendly: Simple to understand but powerful enough for professional traders.
Why Download from IndicatorForest.com
At IndicatorForest.com, traders can download the Synergy TDI Indicator for MT4 safely and quickly. The platform provides trusted indicators, expert guides, and consistent updates. Whether you’re a beginner or an expert, IndicatorForest.com helps enhance your trading with reliable tools and educational content.
Conclusion
The Synergy TDI Indicator for MT4 is a complete market analysis tool that gives traders a clear view of momentum, trend, and volatility. Its combination of RSI, signal lines, and volatility bands makes it ideal for identifying accurate entry and exit points. Download the indicator today from IndicatorForest.com and upgrade your trading strategy with powerful insights.
FAQ
2 Downloads
Published:
Dec 10, 2025 22:36 PM
Category: