Elevating Technical Analysis with the CCI Ranked Indicator
The Commodity Channel Index (CCI) has long been a staple in the toolkit of professional Forex and CFD traders. Originally developed by Donald Lambert to identify cyclical turns in commodities, it has transitioned seamlessly into liquid currency pairs. However, standard momentum oscillators often generate a high frequency of false readings or stay pinned in overbought and oversold territories during strong market expansions. The CCI Ranked Indicator updates this classic concept by organizing mathematical momentum data, offering traders an advanced framework for identifying reversals and tracking Trend Strength.
The Architecture Behind CCI Ranked Calculations
At its functional core, the CCI Ranked Indicator tracks the mathematical relationship between the current price of an asset, its moving average baseline, and normal deviations from that baseline. The core algorithm typically calculates the current asset valuation against structural parameter inputs—such as a 5-period fast smoothing interval coupled with a 63-period macro ranking baseline.
Unlike basic oscillators that simply plot a raw mathematical line, a ranked momentum system standardizes and sorts past data performance. This helps traders judge the significance of current momentum anomalies against historical conditions:
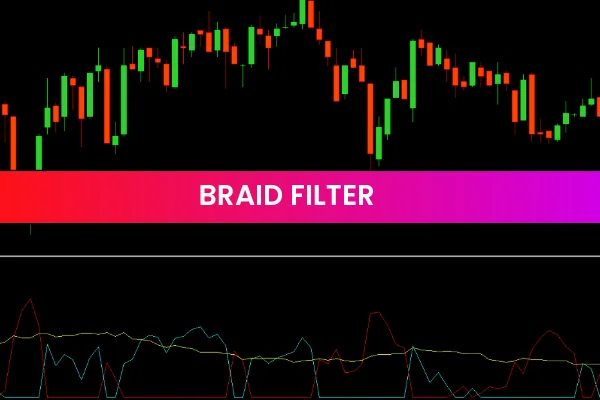
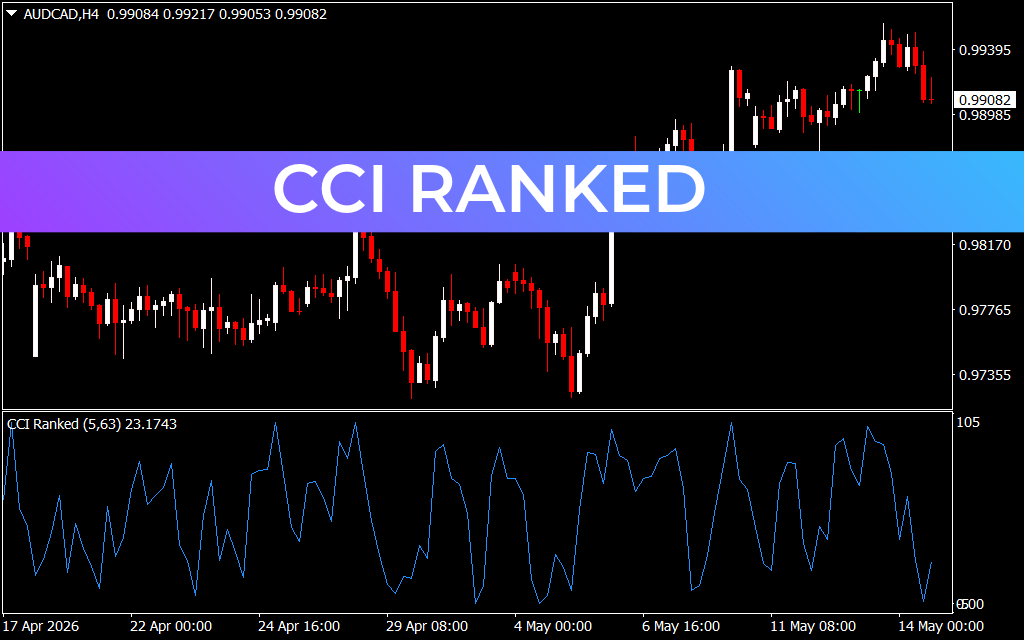
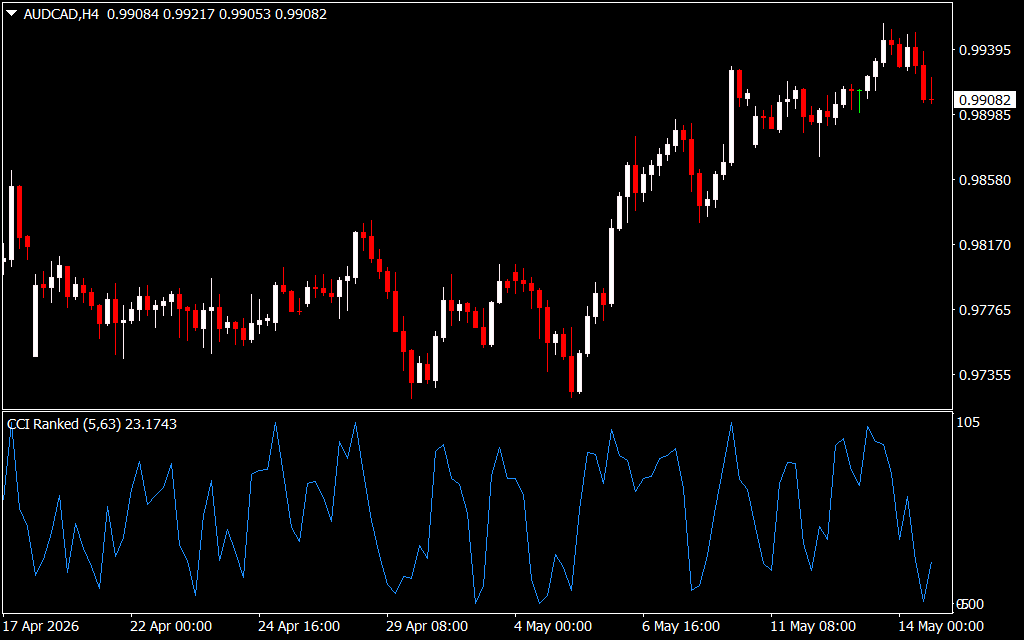
- Sustained Extremes: When the blue signal line peaks near the upper boundaries of the technical sub-window, it confirms that the market is pushing into significant overbought thresholds based on historical data.
- Deep Value Valleys: When the signal line plunges toward the lowest technical baselines, it flags deep oversold regions where selling pressure has historically exhausted itself, setting up high-probability swing plays.
Implementing CCI Ranked into Your Trading Strategy
Integrating this tool into your daily trade template gives you clear, mechanical filters for execution and risk management:
- Momentum Divergence Plays: One of the most effective ways to deploy the CCI Ranked indicator is by tracking price structural divergence. If Price Action prints a minor higher high on the main chart, but the oscillator sub-window prints a significantly lower peak, it reveals a hidden loss of buying velocity. This divergence serves as an early warning to trail your stop-losses tightly or book profits.
- Trend Reversal Confirmations: Traders can watch for the signal line to exit extreme overbought or oversold zones. A clean cross back inside the normalized trading bounds indicates an influx of counter-trend volume, providing a definitive, mechanical trigger for swing trade execution.
- Dynamic Support And Resistance: Rather than relying exclusively on fixed lines, the historical ranking model highlights key zones where institutional buyers and sellers have historically rebalanced their exposure.
Swing Trading Precision on the 4-Hour (H4) Chart
While scalable to shorter intraday timeframes, the CCI Ranked Indicator delivers exceptional mechanical clarity on macro timeframes like the 4-hour (H4) chart. As shown on the AUD/CAD H4 layout, the tool smooths out noisy daily fluctuations, neatly isolating structural market waves over weeks of chart activity. By matching your macro trend entries with these normalized oscillator zones, you can execute trades backed by institutional momentum.
1 Download
Last Update:
May 14, 2026 21:12 PM
Published:
Jan 22, 2026 01:12 AM
Category: