Maximize Market Precision with the TDI TR Colorful Indicator
In the competitive world of day trading, having a single indicator that can filter noise, identify trends, and spot reversals is a significant advantage. The TDI TR Colorful (Traders Dynamic Index) is a professional-grade technical tool for MetaTrader that has become a staple for traders globally. By integrating multiple layers of mathematical data into one readable window, it provides a holistic view of market sentiment that standard indicators often miss.
The Anatomy of the TDI TR Colorful
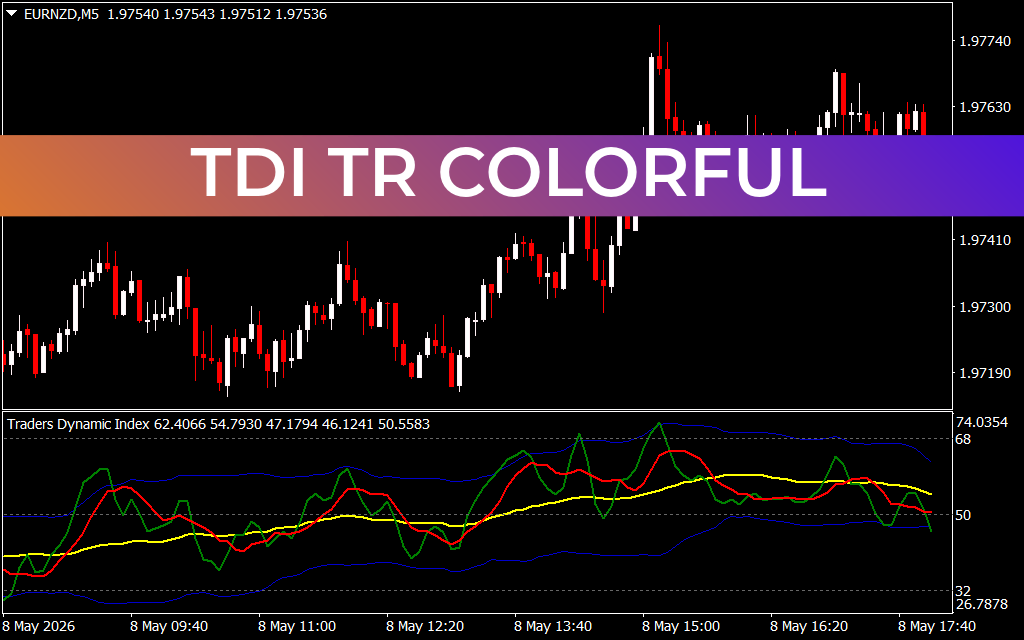
The TDI is more than just an oscillator; it is a hybrid indicator that uses four distinct components to analyze Price Action:
- The RSI Price Line (Green): This tracks the immediate sentiment and price momentum. When the green line is rising, the bulls are in control.
- The Trade Signal Line (Red): A smoothed moving average of the RSI. Crossovers between the green and red lines provide high-probability entry and exit signals.
- Volatility Bands (Blue): Based on the concept of Bollinger Bands, these lines show the market's current volatility. When the bands contract (a "squeeze"), a major breakout is usually imminent.
- The Market Base Line (Yellow): This represents the overall trend bias. If the other lines are above the yellow line, the market is in a structural uptrend.
Strategic Benefits for MT4/MT5 Traders
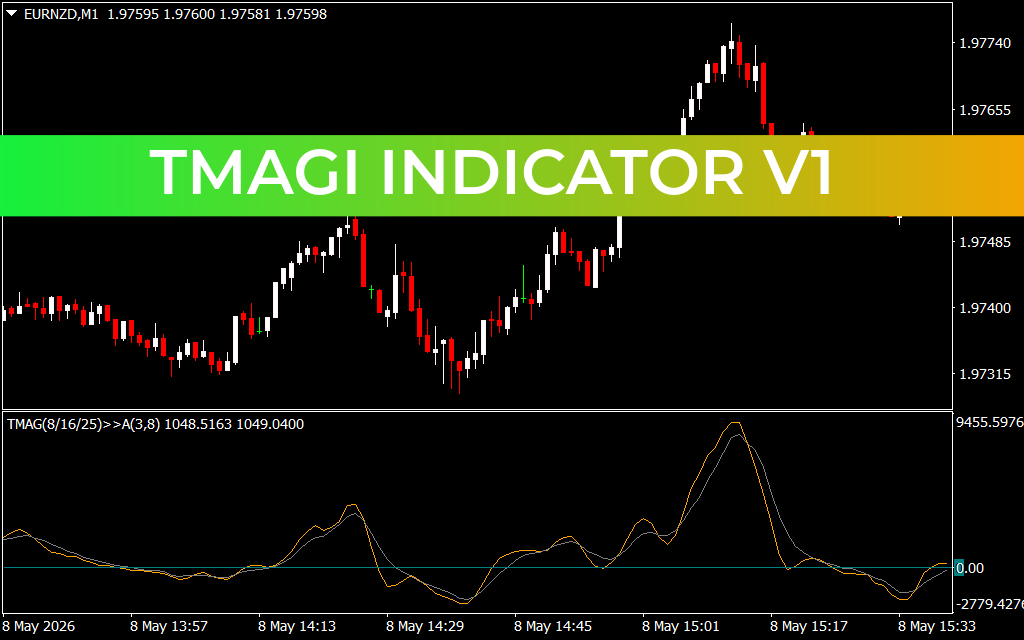
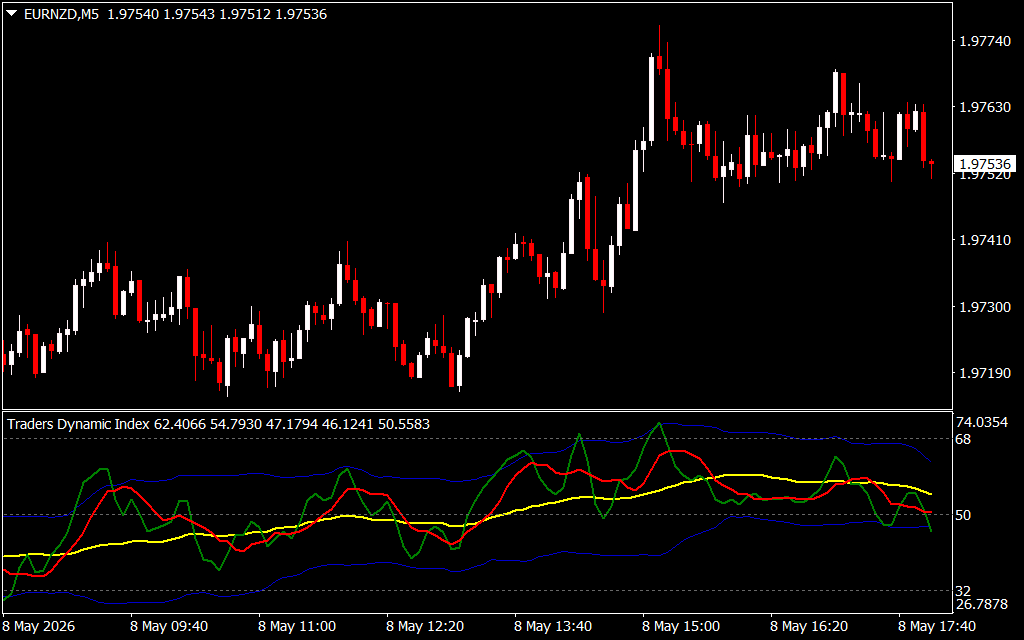
- Trend Confirmation: As seen in the EURNZD M5 example, the TDI TR Colorful excels at keeping traders on the right side of the trend. When the green line crosses above the red line while both are above the yellow line, it signals a strong bullish continuation.
- Volatility Filtering: One of the biggest challenges for traders is entering a trade when the market is "flat." The TDI's blue bands alert you to low-volatility periods, helping you avoid choppy markets and preserve your capital.
- Overbought/Oversold Detection: Unlike a standard RSI, the TDI uses fixed levels (typically 68 and 32) to show when a trend is reaching its statistical limit. A green line crossing back below the 68 level is a classic sign of profit-taking or a potential reversal.
- Visual Clarity: The "Colorful" version of this indicator enhances the visual experience, making it easier to distinguish between different market phases at a single glance.
Trading the TDI Strategy
The most popular way to trade with the TDI TR Colorful is the "Shark Fin" reversal pattern. This occurs when the green RSI line aggressively pierces outside the blue volatility bands and then quickly hooks back inside, crossing the red signal line. This pattern often marks the absolute peak or trough of a move, providing an excellent risk-to-reward ratio for contrarian traders.
Whether you are a scalper looking for quick M5 momentum bursts or a swing trader following H4 structural trends, the TDI TR Colorful provides the confluence needed to trade with professional-level accuracy. By consolidating trend, momentum, and volatility into one interface, it simplifies your chart and sharpens your execution.e trades with ease.
1 Download
Last Update:
May 08, 2026 21:03 PM
Published:
Jan 25, 2026 17:57 PM
Category: