Precision Market Timing with the Tipama Indicator
In the complex ecosystem of technical analysis, traders are constantly searching for tools that can cut through market "noise" to reveal the underlying trend. The Tipama Indicator is a sophisticated momentum-based tool designed for the MT4 and MT5 platforms. It provides a visual representation of market strength and direction, allowing traders to align their entries with the highest probability price movements. By focusing on volume and price acceleration, Tipama offers a distinct advantage in identifying early reversals and trend continuations.
Understanding the Tipama Methodology
The Tipama Indicator operates as an oscillator, typically displayed in a separate sub-window beneath the main price chart. It utilizes a proprietary algorithm that calculates the rate of change in price relative to historical volatility. Unlike standard oscillators that can become pinned at extreme levels during strong trends, Tipama remains responsive, providing a clearer picture of when a move is losing steam or gaining fresh momentum.
Key Features and Strategic Advantages
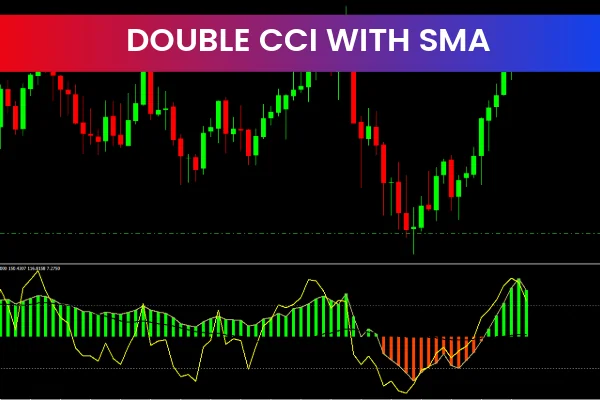
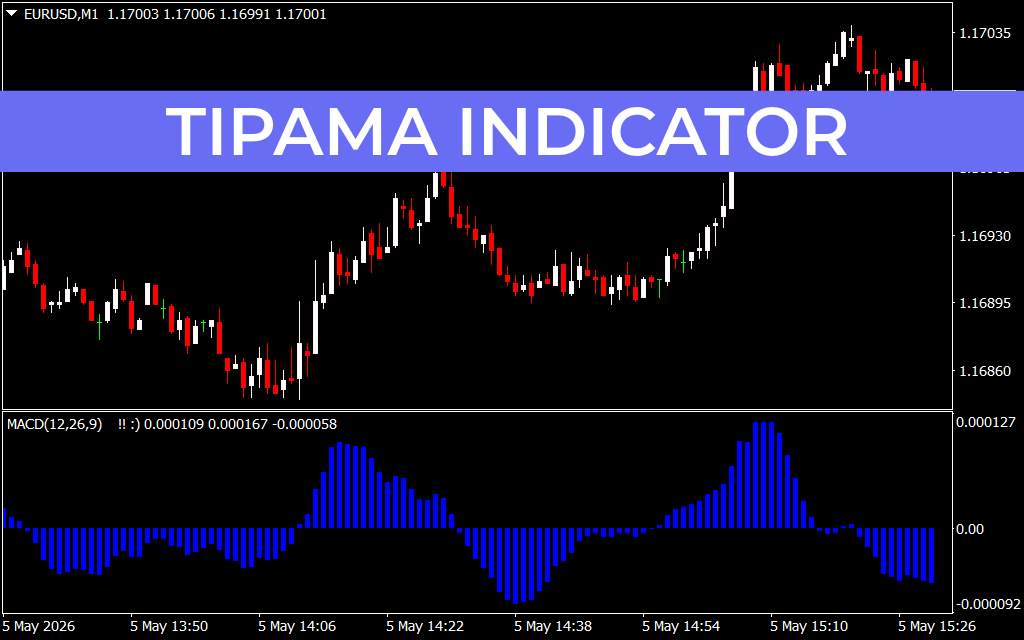
- Visual Histogram Logic: The indicator uses a histogram format (as shown in the sub-window of the chart) to represent bullish and bearish energy. Blue bars rising above the zero line indicate bullish dominance, while bars falling below signal bearish control.
- Zero-Line Crossover Signals: One of the most reliable ways to use this tool is the zero-line crossover. A transition from negative to positive suggests a burgeoning uptrend, while a move from positive to negative indicates a shift toward a downtrend.
- Divergence Identification: Tipama is exceptional at spotting "divergence"—where price makes a new high but the indicator makes a lower high. This is often a precursor to a major Trend Reversal.
- Scalping Compatibility: Due to its high sensitivity to price shifts, it is a premier choice for 5 minutes scalping and fast-paced intraday trading.
Practical Trading Insights
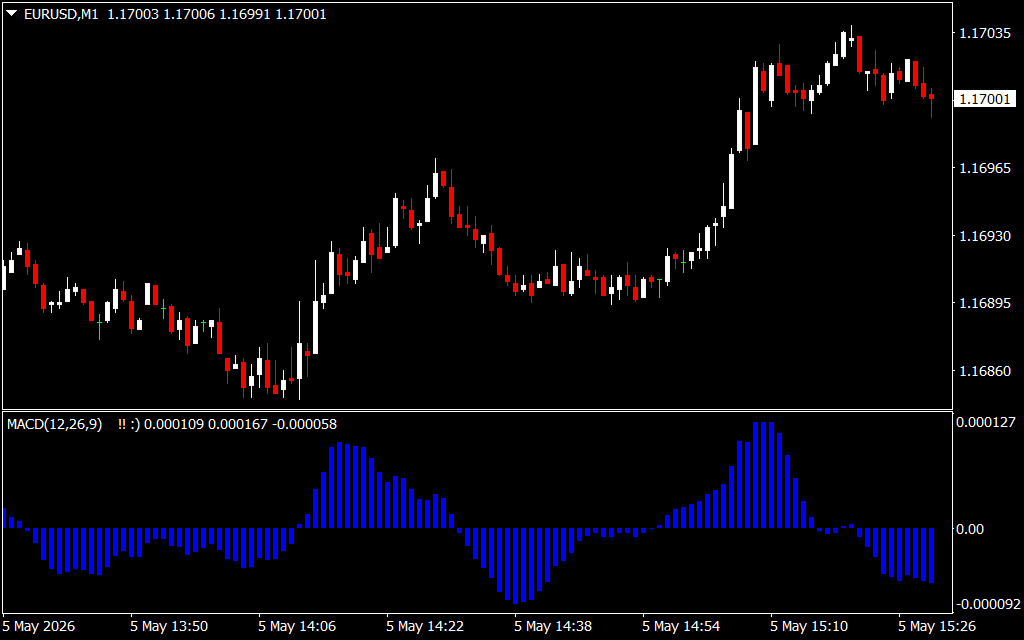
To see the indicator in action, refer to the file EURUSDM1.png. In this M1 timeframe, you can see how the histogram bars grow in height as the price accelerates, providing a clear visual cue of trend intensity.
When integrating Tipama into your Forex trading strategies, it is often best used as a confirmation tool. For instance, if you are utilizing a Price Action strategy and spot a bullish pin bar at a major support level, a corresponding green or rising bar on the Tipama histogram provides the technical "green light" to execute the trade. For momentum trading, the goal is to enter when the histogram is at its steepest slope, indicating that institutional volume is driving the move.
Why Tipama Belongs in Your Technical Arsenal
The primary challenge for most retail traders is distinguishing a minor pullback from a full-blown trend reversal. The Tipama Indicator solves this by quantifying market energy. It helps you stay in winning trades longer by showing that momentum is still positive, and it protects your capital by signaling when a trend has become exhausted.
Whether you are refining your technical analysis skills or searching for a robust trend-following system, the Tipama Indicator provides the structural clarity needed to navigate the markets with confidence. By smoothing out erratic price fluctuations, it allows you to focus on the trades that truly matter.
2 Downloads
Last Update:
May 05, 2026 18:31 PM
Published:
Jan 27, 2026 14:54 PM
Category: