Maximizing Multi-Asset Clarity: The Trend Direction Dashboard Indicator
Navigating the global currency markets requires processing massive streams of real-time data across various financial instruments and timeframes. Retail traders often limit their potential by tracking only one or two pairs, missing profitable setups across the broader market. Conversely, attempting to monitor dozens of charts manually quickly leads to cognitive fatigue and execution errors. The Trend Direction Dashboard Indicator resolves this complexity, condensing multi-pair, multi-timeframe structural data into a single, comprehensive visual workspace on your MetaTrader screen.
Here is an in-depth breakdown of how this ultimate tracking terminal works and how to implement it to streamline your daily market scanning.
The Power of Matrix-Based Multi-Timeframe Scanning
To gain a real edge in the markets, professional traders look for alignment across different lookback periods. For example, executing a short position on a 5-minute chart carries a much higher probability of success if the 1-hour, 4-hour, and Daily trends are also in a strong markdown phase.
The Trend Direction Dashboard Indicator automates this confirmation process. Acting as an advanced algorithmic scanner, it continuously analyzes Price Action, moving averages, and momentum parameters across dozens of currency pairs simultaneously. Instead of forcing you to open separate windows for each asset, it coordinates this data into a centralized, matrix-style interface, letting you identify strong institutional trends and market correlations at a single glance.
Reading the Dashboard Interface and Visual Matrix
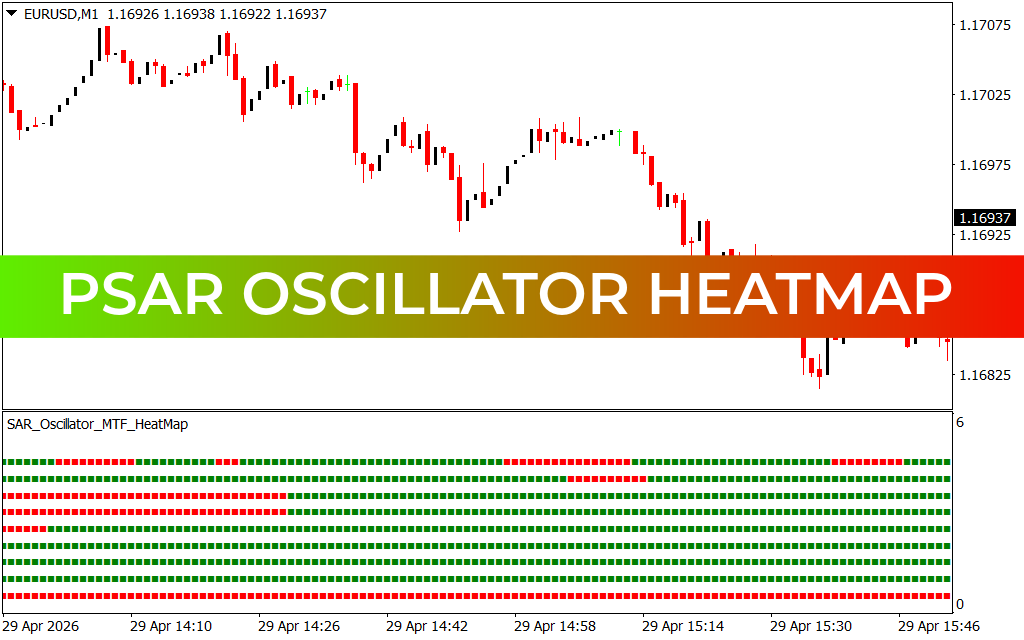
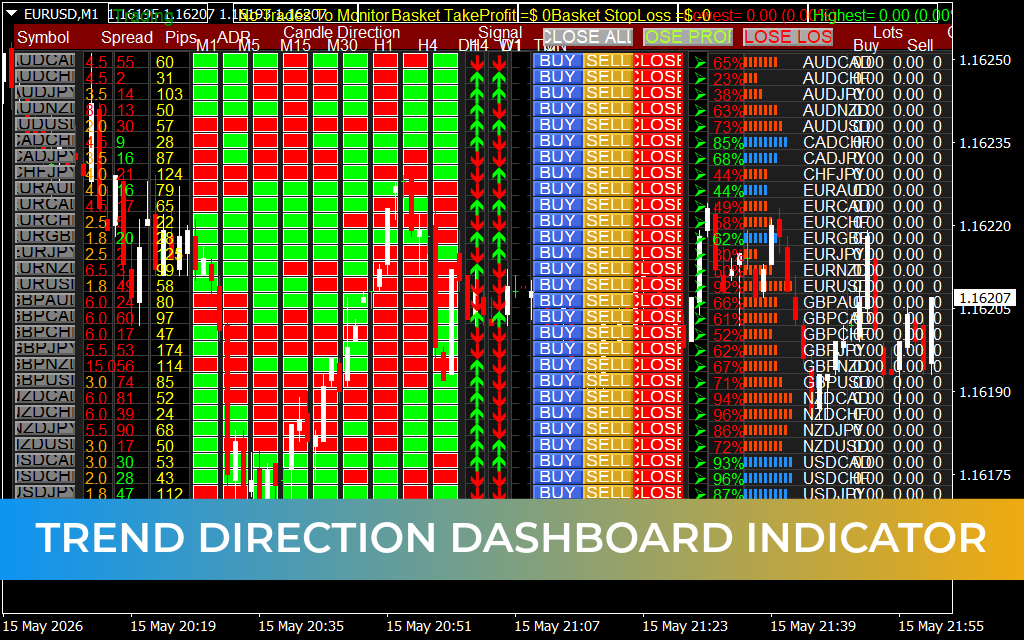
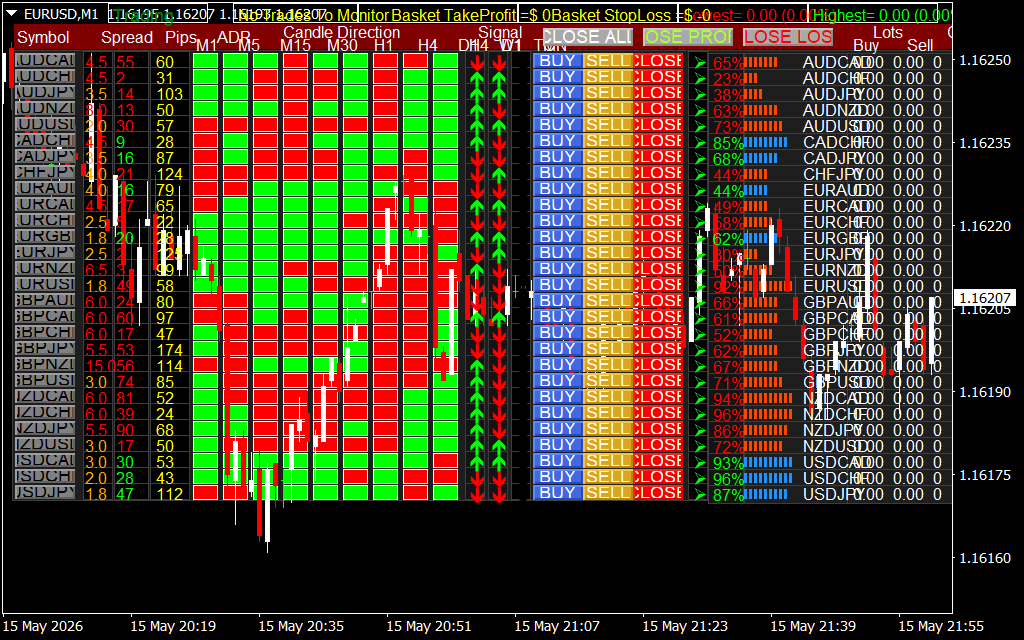
As shown on the EUR/USD 1-minute chart setup, the dashboard functions as a professional command center overlay, completely transforming your terminal with actionable data points:
- Comprehensive Asset Watchlist (Vertical Column): The left side of the dashboard displays a clean, vertical roster of major and minor currency crosses (such as AUD/CAD, AUD/CHF, and AUD/JPY). This column keeps you updated on cross-pair performance without changing your active screen.
- Multi-Timeframe Trend Grid (M1 to MN1 Blocks): The core of the dashboard uses color-coded blocks to represent trend states across every significant timeframe. Bright green blocks denote strong bullish momentum, while vibrant red blocks signal clear bearish liqudation. When a pair displays an unbroken row of matching colors, it alerts you to a highly efficient macro trend.
- Real-Time Spread and Volatility Data: Next to each ticker, the dashboard displays active spread conditions and Average Daily Range (ADR) statistics. This critical information ensures you never execute a trade during low-liquidity periods or when wide spreads threaten your risk margins.
Operational Guidelines for Portfolio Scanners
To maximize the performance of this trend dashboard on your terminal, integrate these active trading rules into your daily workflow:
- Trade Pure Confluence Profiles: Use the dashboard as a strict structural filter. Scan the matrix for assets showing complete color synchronization across consecutive timeframes (e.g., M15, M30, H1, and H4 all printing red). Focus your discretionary execution setups exclusively on these high-confluence instruments.
- Identify Market Turning Points: Watch for sudden color changes within the lower-timeframe columns (like M1 or M5). When an asset that is heavily trending green on macro charts begins printing red blocks on intraday views, it signals a localized pullback, allowing you to time your pullbacks with extreme precision.
- Automate Portfolio Management: Use the built-in execution buttons—such as "CLOSE ALL", "CLOSE PROFIT", and "CLOSE LOSS"—integrated right on the dashboard panel. This feature allows you to manage multi-asset baskets simultaneously, ensuring quick risk mitigation during sudden macroeconomic news events.
12 Downloads
Last Update:
May 17, 2026 02:32 AM
Published:
Jan 20, 2026 22:28 PM
Category: