Precision Trend Following with the Trend Viper Histogram Indicator for MT4
In the fast-paced world of technical analysis, the ability to distinguish between a genuine trend and market noise is what separates profitable traders from the rest. While standard moving averages often lag, the Trend Viper Histogram Indicator for MetaTrader 4 (MT4) offers a refined, visual solution for identifying momentum shifts in real-time. By utilizing a sophisticated smoothing algorithm, this indicator provides traders with a clear, color-coded map of market sentiment, making it an essential tool for trend followers and scalpers alike.
Decoding the Trend Viper Logic
The Trend Viper Histogram is a "momentum-oscillator" hybrid. It calculates the relationship between Price Action and trend velocity, displaying the results as a vertical histogram below the main price chart. This visual separation allows traders to keep their main charts clean while still receiving high-fidelity signals.
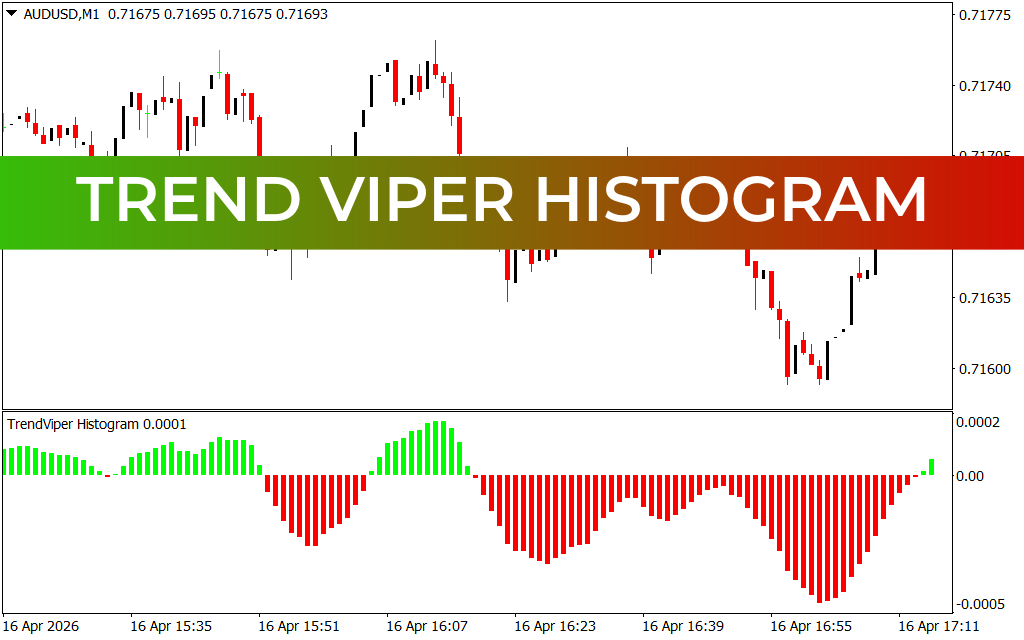
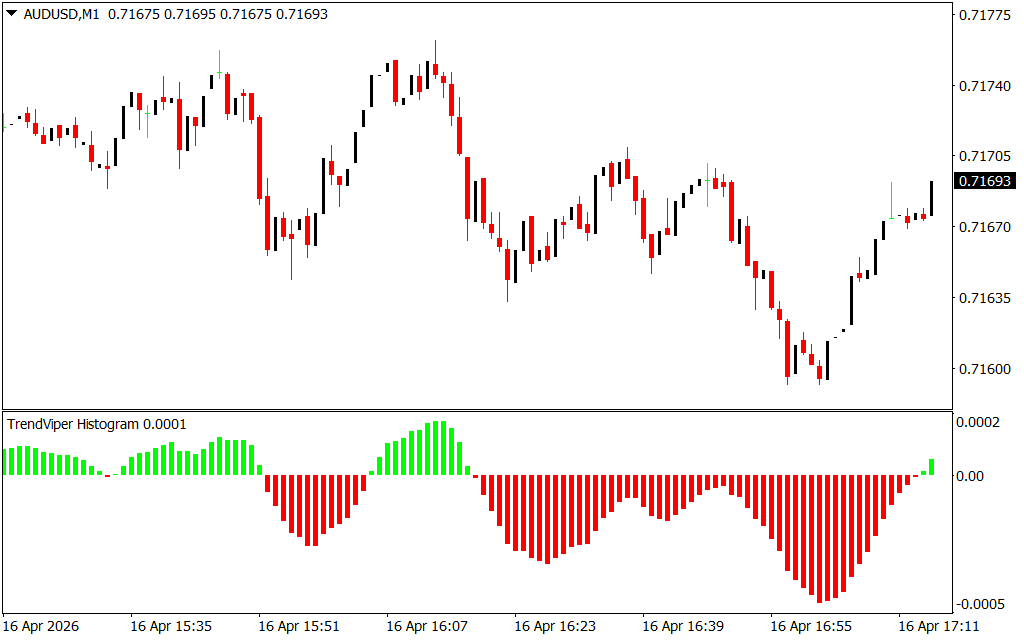
As seen in the AUD/USD M1 analysis, the Trend Viper Histogram operates on a simple yet powerful color-coded system:
- Green Momentum Bars: When the bars rise above the zero line and turn green, it indicates a confirmed bullish regime. The height of the bars represents the strength of the move; increasing bar height suggests accelerating momentum.
- Red Momentum Bars: Conversely, bars below the zero line that turn red signal a dominant bearish trend. This allows traders to avoid "buying the dip" in a falling market and instead look for high-probability sell entries.
- The Zero-Line Cross: The most critical signal occurs when the histogram crosses the zero midpoint. This often marks the early stage of a Trend Reversal, providing a strategic entry point before the move becomes obvious to the broader market.
Strategic Advantages for Intraday Traders
The Trend Viper Histogram is engineered for those who require objective data to make split-second trading decisions.
- Noise Filtration: By focusing on histogram slopes rather than erratic price candles, the indicator filters out the "market static" that often leads to false breakouts.
- Divergence Identification: Professional traders use the Trend Viper to spot "hidden divergence." If price makes a higher high but the Trend Viper Histogram makes a lower high, it warns of a weakening trend and a potential looming reversal.
- Scalping Precision: On lower timeframes like the M1 or M5, the histogram acts as a high-speed filter. It ensures that scalpers are always trading in the direction of the immediate momentum "burst," significantly increasing the win rate of quick-flip strategies.
- Universal Compatibility: Whether you are trading Forex majors, Gold, or Crypto, the Trend Viper algorithm scales its sensitivity to match the specific volatility of the asset you are analyzing.
Conclusion
The Trend Viper Histogram Indicator for MT4 is more than just a trend filter; it is a comprehensive momentum analysis suite. By providing clear visual cues for Trend Strength and direction, it removes the emotional guesswork from technical trading. Elevate your MT4 terminal today and experience the clarity of institutional-grade trend following with Trend Viper.
9 Downloads
Last Update:
Apr 16, 2026 20:17 PM
Published:
Feb 10, 2026 17:02 PM
Category: