Master Geometric Chart Patterns with the Triangles Indicator
In technical analysis, classical chart patterns represent the footprint of institutional Supply And Demand. Among these, triangle formations—including symmetrical, ascending, and descending triangles—are highly valued by professional day traders and swing traders. These geometric structures map phases of market consolidation, showing a temporary equilibrium where price compression stores massive energy. When the market breaks out of these boundaries, it frequently triggers explosive, high-velocity trend expansions.
However, manually tracing geometric lines across multiple instruments can be highly subjective and time-consuming. The Triangles Indicator automates this complex process, continuously identifying and drawing verified pattern boundaries right onto your MetaTrader canvas.
The Power of Automated Market Geometry
When managing volatile financial markets across various intervals, analyzing the chart without automated help can cause you to miss emerging macro structures. The Triangles Indicator functions as an intelligent pattern recognition engine, evaluating swing highs and swing lows to detect structural convergence.
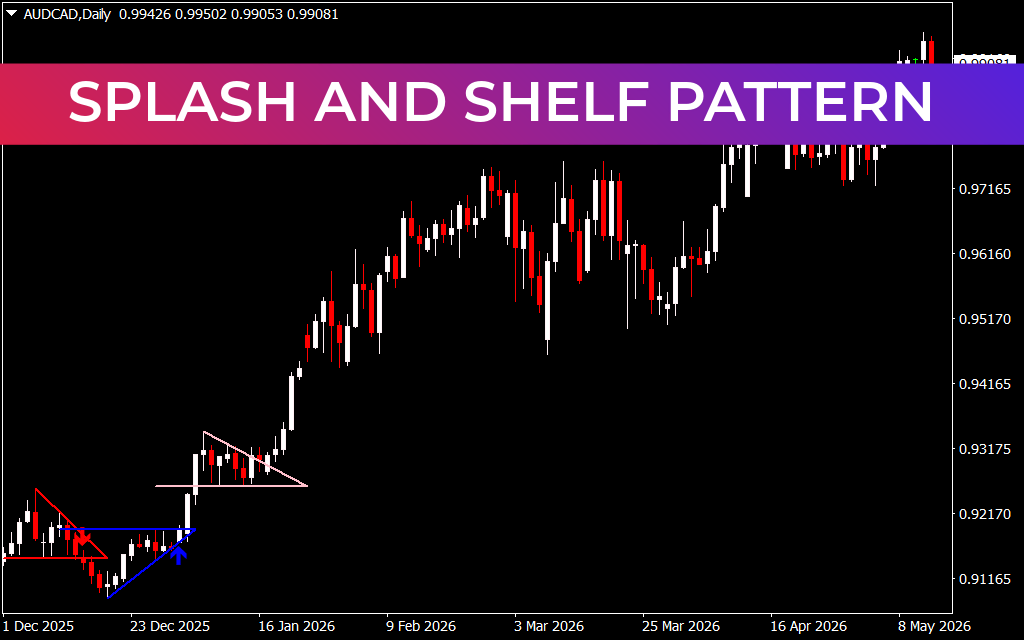
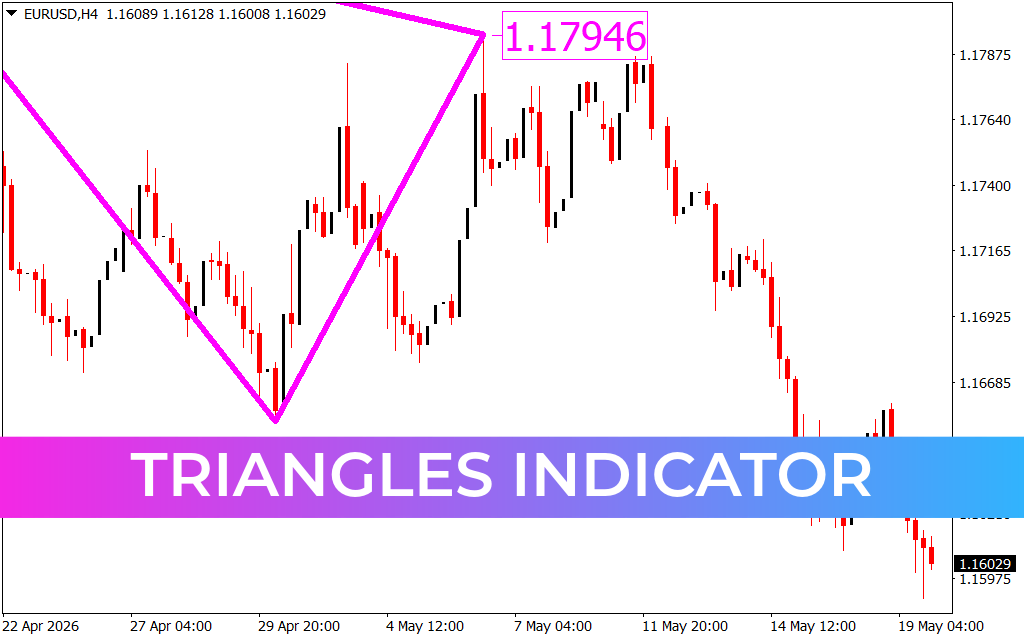
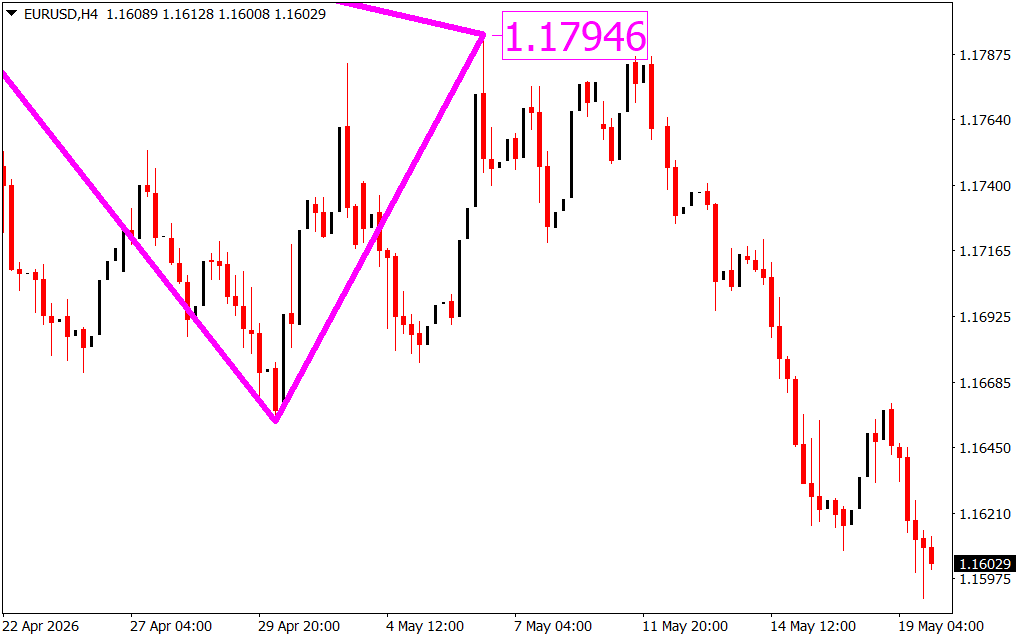
As demonstrated on the 4-hour ($H4$) EUR/USD chart, the software eliminates human charting errors by implementing a systematic mapping template:
- Dynamic Boundary Tracking: The indicator connects major structural pivot peaks and troughs with highly visible, thick magenta layout rays. This instantly highlights contraction zones where trading volume is building up for a significant release.
- Objective Target Projection: Upon mapping a structural convergence point, the utility displays vital price milestones—such as the exact target level labeled at 1.17946. This gives technical analysts a precise, math-driven blueprint for potential trend extensions.
- Multi-Timeframe Versatility: The underlying code is optimized to track macro patterns on higher intervals like the $H4$ chart just as effectively as short-term Scalping structures on lower timeframes.
Implementing Rule-Based Triangle Execution Strategies
Integrating the Triangles Indicator into your regular trading workspace establishes a mechanical approach to navigating market contraction phases.
1. Executing the Clean Breakout
The primary strategy for geometric structures involves trading the initial breakout. When a candle closes decisively outside of the indicator’s magenta lines, it signals that the consolidation period has concluded and a dominant side has taken control. For example, a bullish close above the upper descending trendline triggers a high-probability entry toward the projected target milestone.
2. Managing Risk via Structural Invalidations
One of the greatest challenges of classical chart patterns is managing false breakouts or "fakeouts." The Triangles Indicator addresses this by providing clear, visual geometric reference points. If an asset breaks out to the upside, the recent inner swing low within the triangle apex serves as an objective, rule-based level for invalidating the setup and managing risk.
Conclusion
The Triangles Indicator is an essential technical assistant for any trader specializing in Price Action geometry. By automating pattern identification and projecting accurate extension milestones, it allows you to trade structural breakouts with absolute objectivity. Download the Triangles Indicator today to upgrade your MetaTrader platform and unlock the power of automated chart patterns.
11 Downloads
Last Update:
May 20, 2026 01:58 AM
Published:
Jan 19, 2026 11:00 AM
Category: