Take the Guesswork Out of Technical Analysis with the TrueTL V1 Indicator
Drawing accurate trendlines is one of the most fundamental skills in Forex trading. Yet, it remains highly subjective. Two traders looking at the exact same chart will often draw two completely different structural boundaries. This visual inconsistency frequently leads to costly false breakouts and poorly timed entries.
The TrueTL V1 (True Trendline) indicator solves this structural dilemma by automating the process entirely. Built on a mechanical pattern recognition algorithm, this tool dynamically tracks, scales, and prints objective trendlines across your charts in real time.
The Power of Automation on Lower Timeframes
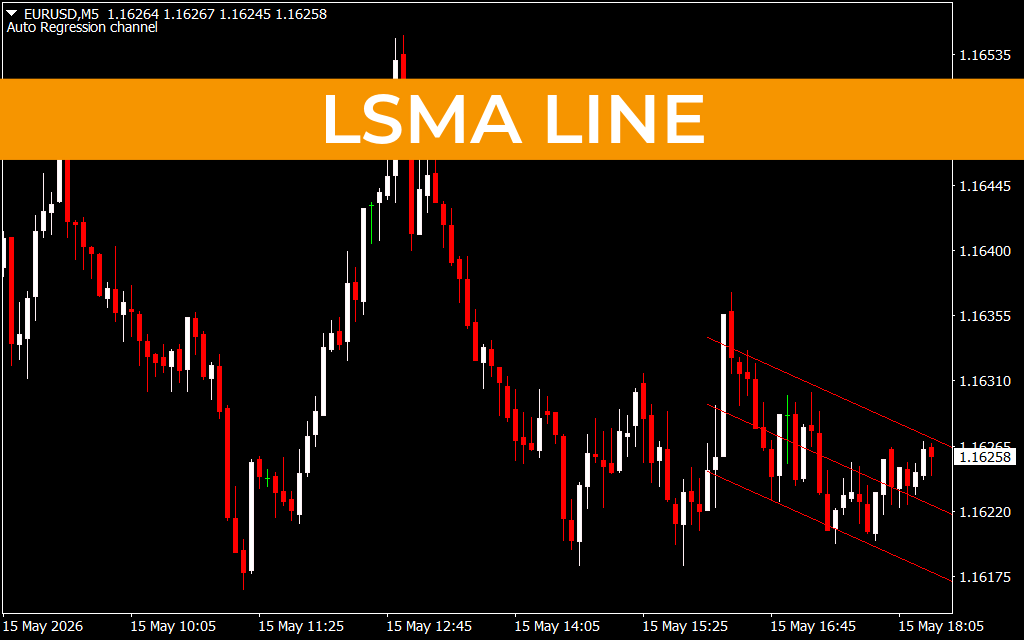
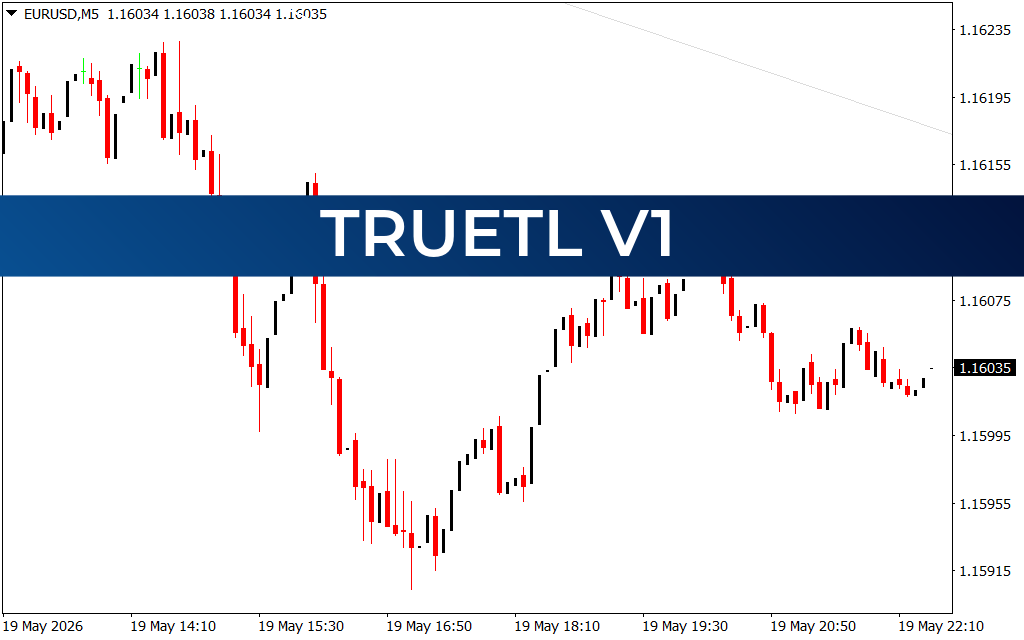
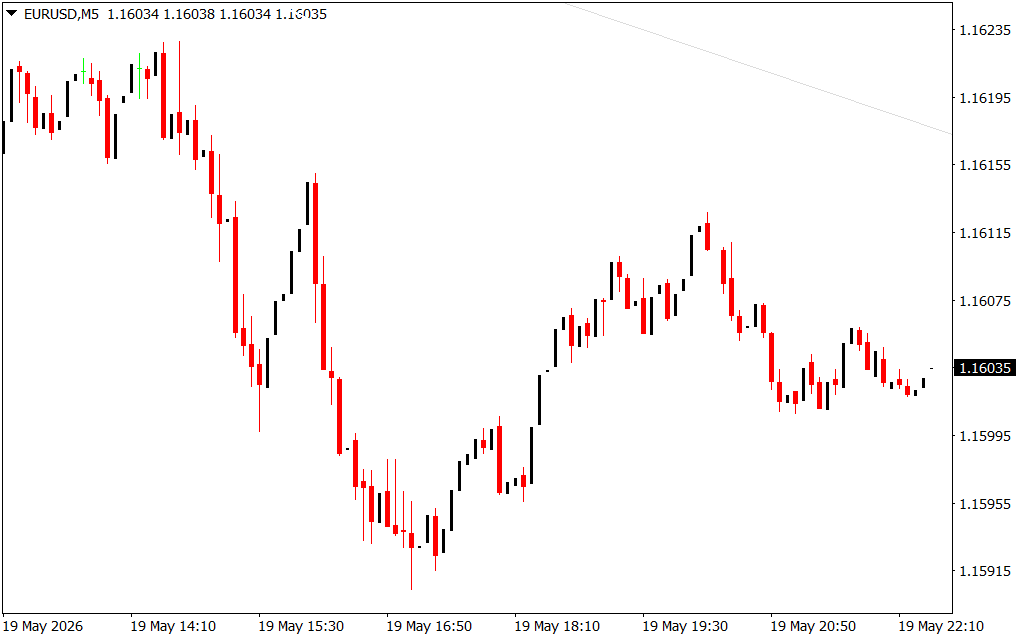
When trading fast-paced, intraday price action, seconds matter. As shown on the 5-minute ($M5$) EUR/USD chart, Market Structure can evolve rapidly. Taking your eyes off the price action to manually select swing points, click-and-drag lines, and delete outdated historical boundaries creates cognitive fatigue.
TrueTL V1 acts as your automated charting assistant by executing three major functions:
- Dynamic Swing Point Recognition: Instead of relying on arbitrary points, the indicator analyzes historical data from your active timeframe to connect mathematically verified pullback levels.
- Smart Trendline Lifecycle Management: The indicator does not leave outdated lines to clutter your view. It automatically modifies the terminal points based on the latest candle behavior, keeping your visual workspace entirely actionable.
- Multi-Condition Precision: TrueTL adapts seamlessly to various trading preferences. It can be toggled to trace lines directly from structural wicks ($High/Low$) or filter out extreme volatility by aligning lines strictly to candle bodies.
Trading Breakouts and Rejections with Objectivity
Automated lines remove the emotional temptation to "bend" a trendline to match an existing bias. With TrueTL V1, you can confidently build clear rule-based trading systems around two key price milestones:
1. Trendline Rejections (Continuation Trades)
When a market trends downward, creating consecutive lower highs, TrueTL projects future diagonal resistance rays. A rejection at these boundaries—especially when confirmed by bearish candlestick patterns—presents a prime, low-risk opportunity to trade with the prevailing macro momentum.
2. Clean Breakouts (Trend Reversals)
A structural shift occurs when price closes decisively on the opposing side of an indicator-generated trendline. TrueTL V1 immediately updates to reflect the breakout, allowing day traders and scalpers to visually capture early momentum shifts right as they happen.
Conclusion
Whether you are Scalping short-term swings on the lower timeframes or establishing key key-levels for swing setups, consistency is vital. The TrueTL V1 indicator replaces human error and charting hesitation with mechanical precision. Add it to your MetaTrader toolkit to streamline your workflow and take control of your market geometry.
1 Download
Last Update:
May 20, 2026 01:34 AM
Published:
Jan 19, 2026 11:32 AM
Category: