Mastering Trend Momentum with the Visual MACD Indicator for MT4
The Moving Average Convergence Divergence (MACD) has long been a staple in the toolkit of technical analysts worldwide. However, traditional histogram-based MACD displays can sometimes feel detached from the immediate Price Action on the main chart. The Visual MACD indicator for MetaTrader 4 (MT4) revolutionizes this classic tool by projecting trend momentum directly onto your candles, offering a more intuitive and responsive way to trade market cycles.
The Evolution of Convergence and Divergence
Standard MACD measures the relationship between two moving averages of prices—typically the 12-period and 26-period EMAs. While the traditional oscillator sits in a sub-window, the Visual MACD utilizes a dynamic cloud-based system (often referred to as an "OSMA ribbon") that lives right on your price chart.
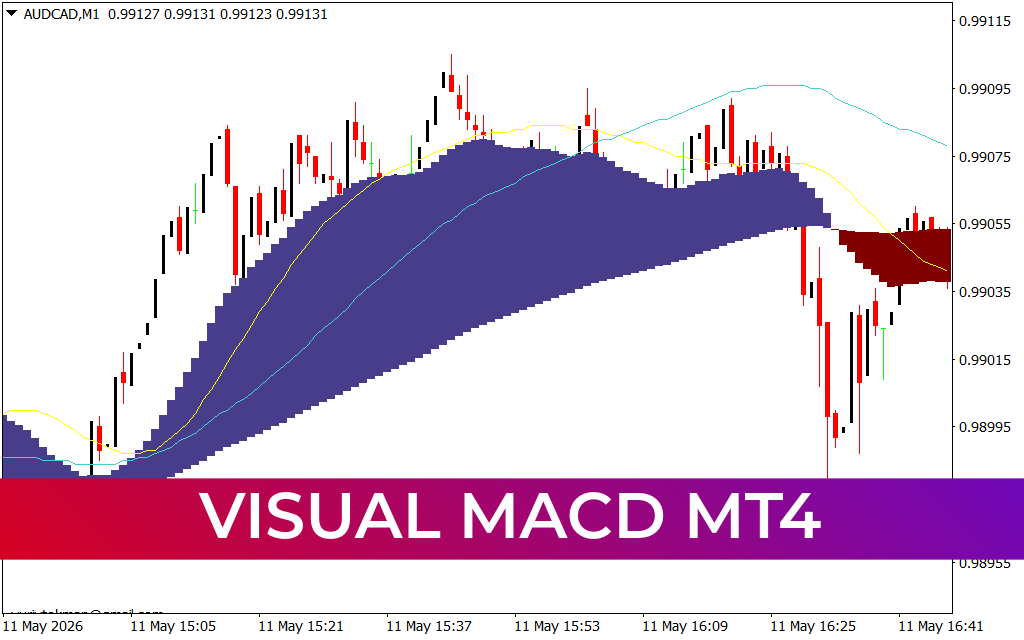
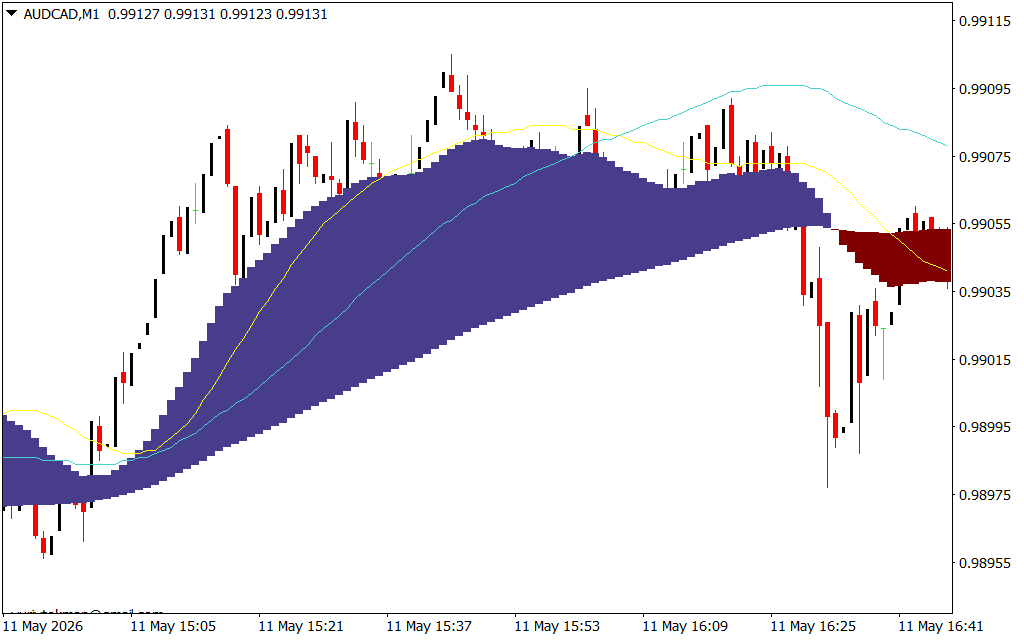
As shown in the AUD/CAD M1 chart, this indicator creates a filled area between the fast and slow components:
- The Blue Cloud: Signifies a bullish MACD crossover where the shorter-term moving average is above the longer-term average, indicating accelerating upward momentum.
- The Dark Red/Maroon Cloud: Signals a bearish crossover, warning traders that the path of least resistance has shifted to the downside.
Precision Entry and Exit Signals
The primary advantage of the Visual MACD is its ability to reduce the "lag" associated with multi-window analysis. By seeing the momentum cloud wrap around the price bars, traders can identify high-probability setups in real-time:
- Trend Confirmation: When price is trading above a thick blue cloud, it confirms a strong bullish trend. This discourages traders from trying to "pick tops" prematurely.
- The Momentum Flip: The moment the cloud transitions from blue to red (or vice versa) is a critical pivot point. These "flips" often precede significant breakouts or trend reversals.
- Cloud Expansion and Contraction: A widening cloud indicates strengthening momentum, while a narrowing cloud suggests that the trend is losing steam and a consolidation phase is likely.
- Support And Resistance: The boundaries of the Visual MACD cloud often act as dynamic support or resistance. In a healthy trend, price will frequently "bounce" off the outer edge of the cloud before continuing its primary move.
Why Every MT4 Trader Needs a Visual MACD
Most retail traders fail because they trade against the momentum. The Visual MACD makes the momentum "unmissable." By color-coding the market's energy, it acts as a constant psychological filter, keeping you on the right side of the trend.
Furthermore, its application on lower timeframes like the M1 (as seen in the AUD/CAD example) makes it an elite tool for scalpers. It provides the surgical precision needed to enter and exit fast-moving markets while ensuring you are backed by the underlying mathematical trend. Whether you are trend-following or looking for mean-reversion at the cloud's extremes, the Visual MACD provides the structural clarity required for consistent profitability.
9 Downloads
Last Update:
May 11, 2026 21:35 PM
Published:
Jan 24, 2026 13:25 PM
Category: