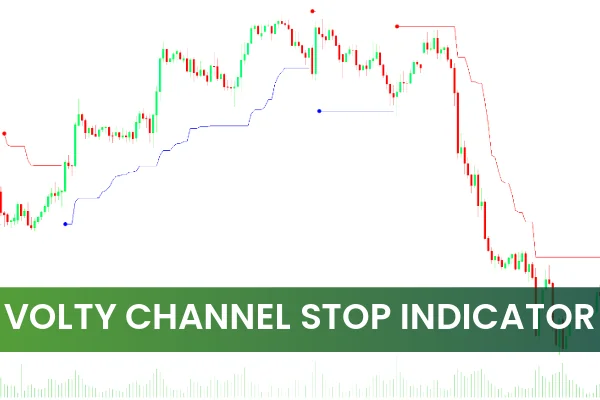
The Volty Channel Stop Indicator for MetaTrader 5 (MT5) is a trend-following and volatility-based trading tool that helps traders identify trend direction and possible reversal points. It combines the Average True Range (ATR) and Moving Average (MA) to display market momentum and key turning zones, giving traders an edge in timing their trades.
This indicator dynamically plots colored channels on the chart — reflecting both the current trend and potential reversal zones — allowing traders to visualize market direction more clearly.
While the Volty Channel Stop is powerful in identifying opportunities, it works best when used in confluence with other indicators such as MACD, RSI, or Price Action signals for enhanced accuracy.
How the Volty Channel Stop Indicator Works
The Volty Channel Stop Indicator operates by combining two core elements:
Moving Average (MA): Tracks the general trend direction.
A rising MA suggests a bullish trend.
A falling MA indicates a bearish trend.
Average True Range (ATR): Measures market volatility to pinpoint possible trend exhaustion or reversal zones.
Higher ATR values indicate stronger volatility and potential breakout conditions.
Lower ATR values suggest consolidation or a stable trend.
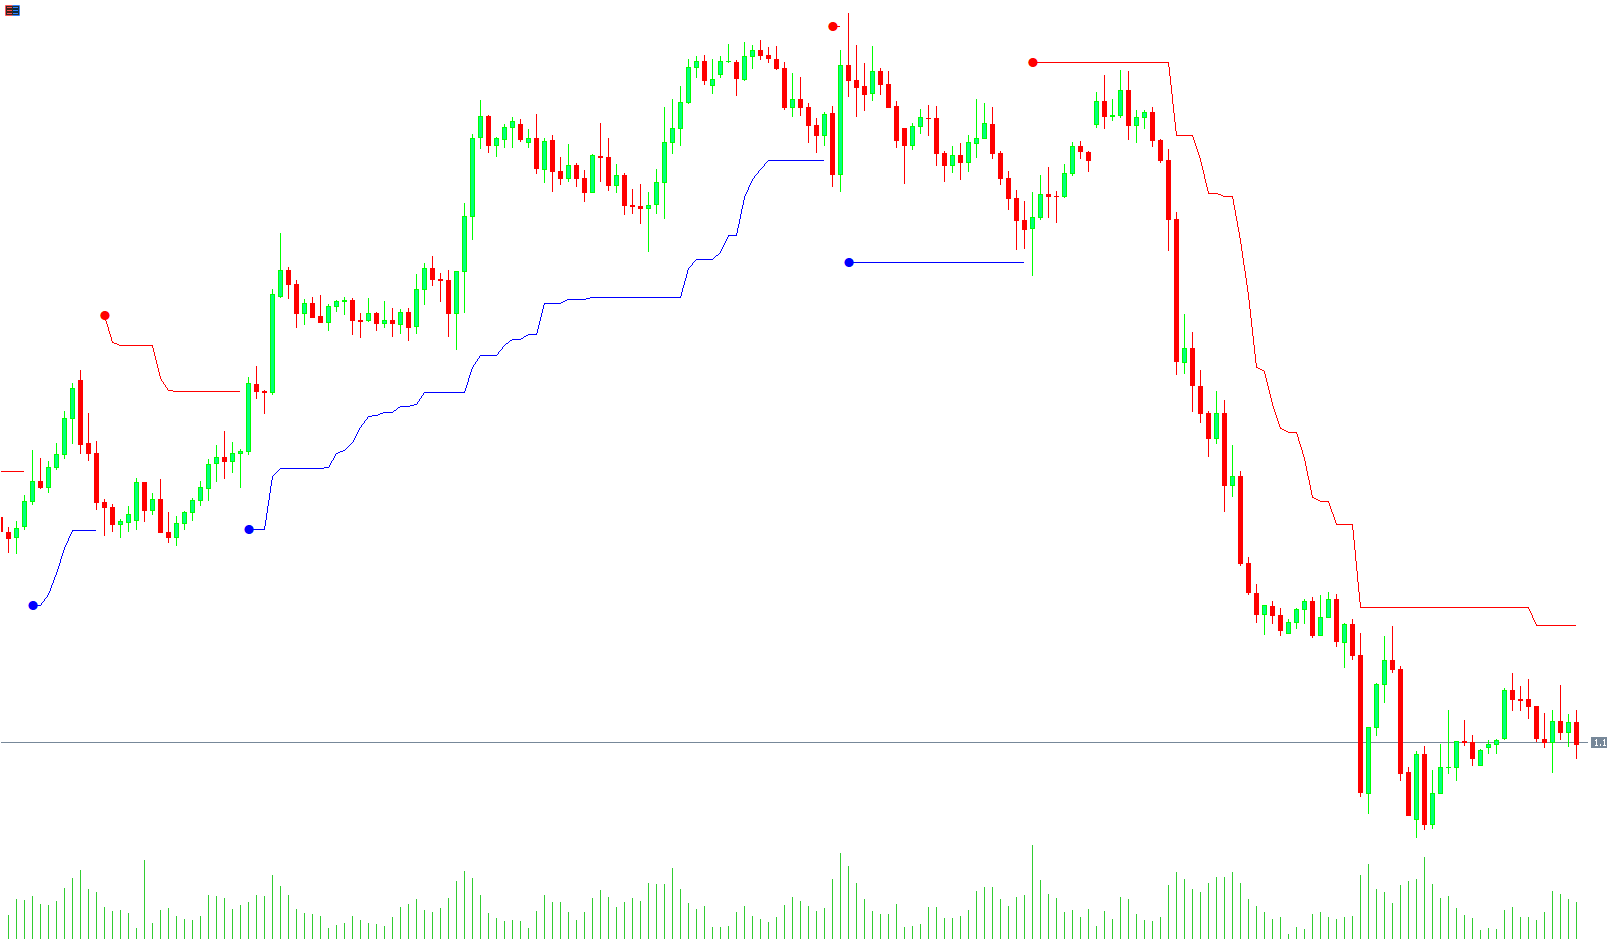
The indicator visually represents these conditions using colored lines and dots:
Blue Line and Dots: Indicate a buy signal or bullish trend continuation.
Red Line and Dots: Indicate a sell signal or bearish trend continuation.
This combination allows traders to clearly see whether the market is trending or preparing for a reversal, making it a versatile addition to any trading strategy.
How to Trade with the Volty Channel Stop Indicator for MT5
Let’s examine how to apply the Volty Channel Stop Indicator for effective trade entries and exits.
Identifying Buy Signals
Look for blue dots appearing below the price candles.
This suggests that the market is entering or continuing a bullish trend.
Confirm the entry by checking if the blue channel line is sloping upward.
Place your stop-loss just below the most recent swing low or the blue channel line.
Exit when the dots turn red or when price crosses below the channel.
Identifying Sell Signals
When red dots appear above the price candles, the indicator signals a bearish trend.
Enter short positions once the red line slopes downward and confirms momentum.
Place your stop-loss above the nearest swing high or the red channel line.
Exit when blue dots appear or when price breaks above the channel.
Confirming with Other Tools
Since the Volty Channel Stop is sensitive to volatility, combine it with other indicators for confirmation:
Use the RSI to confirm overbought/oversold zones.
Combine with MACD or Moving Average crossovers for Trend Confirmation.
Use Candlestick Patterns (engulfing, pin bar) near reversal points for better timing.
Advantages of Using the Volty Channel Stop Indicator
ATR-Based Precision: Uses market volatility to identify reversal zones effectively.
Trend-Following Accuracy: Tracks ongoing trends with moving averages.
Clear Visual Cues: Blue and red dots simplify trade entries and exits.
Versatile Application: Works across forex, stocks, and commodities.
Non-Repainting: Reliable signals for both short-term and long-term traders.
Free Download: Available at IndicatorForest.com.
Best Settings and Timeframes
Timeframes: Works best on M15, H1, H4, and Daily charts.
Recommended Pairs: EURUSD, GBPUSD, USDJPY, and major crosses.
Combine With: RSI, MACD, or other trend filters to improve accuracy.
Conclusion
The Volty Channel Stop Indicator for MT5 is a powerful ATR-based trend and Reversal Indicator that combines volatility analysis with trend-following logic. By plotting dynamic channels and color-coded signals, it provides clear visual guidance for identifying high-probability buy and sell opportunities.
While it should not be used in isolation, when paired with supporting indicators or price action strategies, it becomes a highly reliable component for both new and experienced forex traders.
👉 Download the Volty Channel Stop Indicator for MT5 now at IndicatorForest.com and enhance your trend-following strategy with real-time volatility insights.
FAQ
1 Download
Last Update:
Nov 07, 2025 04:52 AM
Published:
Nov 07, 2025 03:09 AM
Category: