Master Market Cycles with the Wave Indicator M2
In the ever-shifting landscape of financial markets, understanding the underlying trend is the difference between a winning trade and a costly mistake. The Wave Indicator M2 is a professional-grade technical tool designed to decode market complexity by identifying the rhythmic "waves" of Price Action. By providing a clear visual representation of multi-timeframe momentum, this indicator empowers traders to align their entries with the dominant market force.
The Power of Multi-Timeframe Wave Analysis
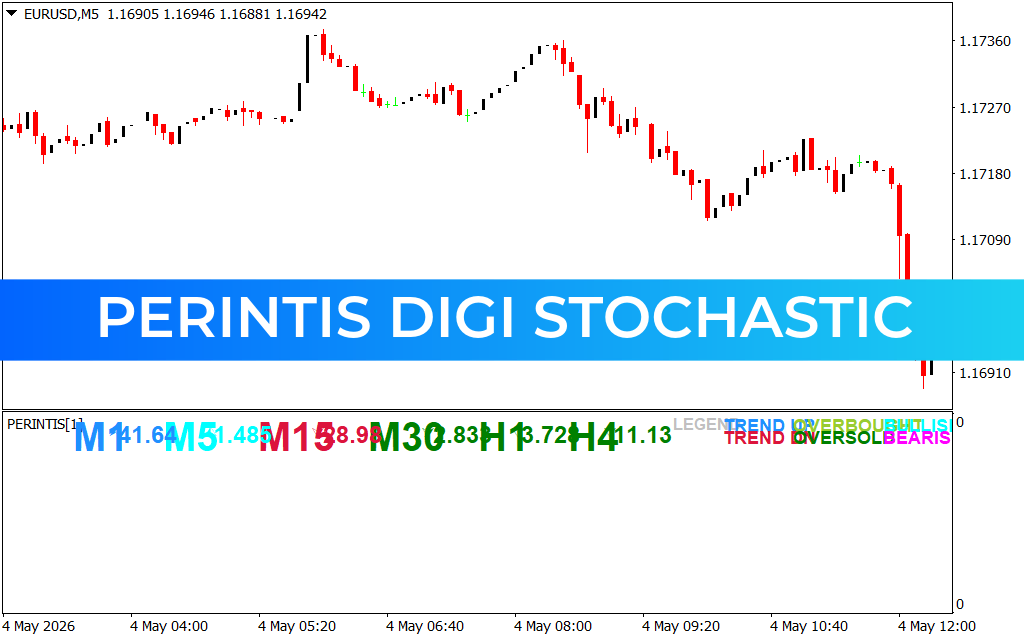
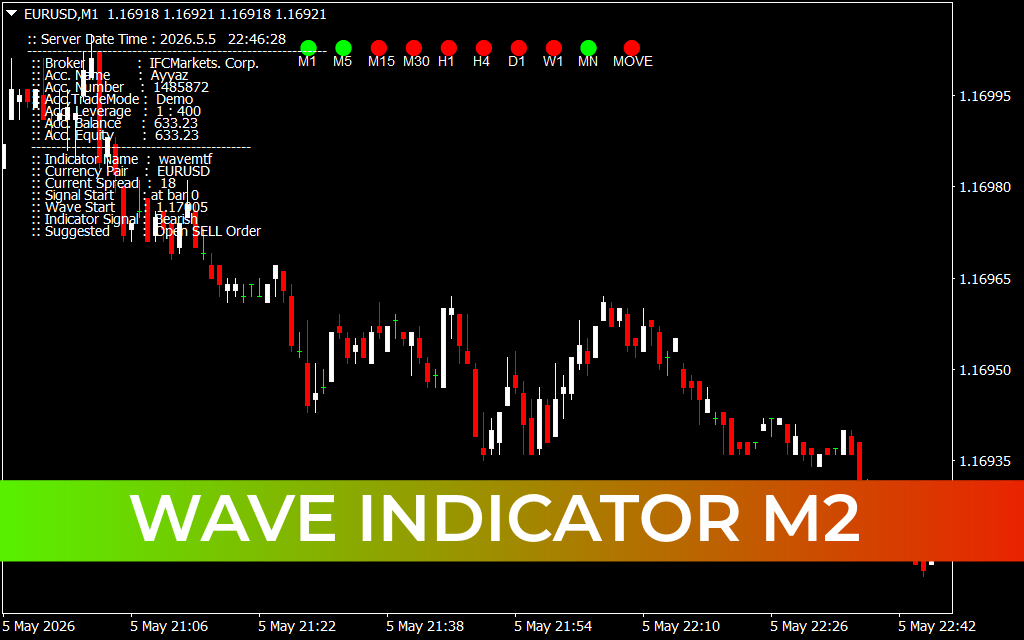
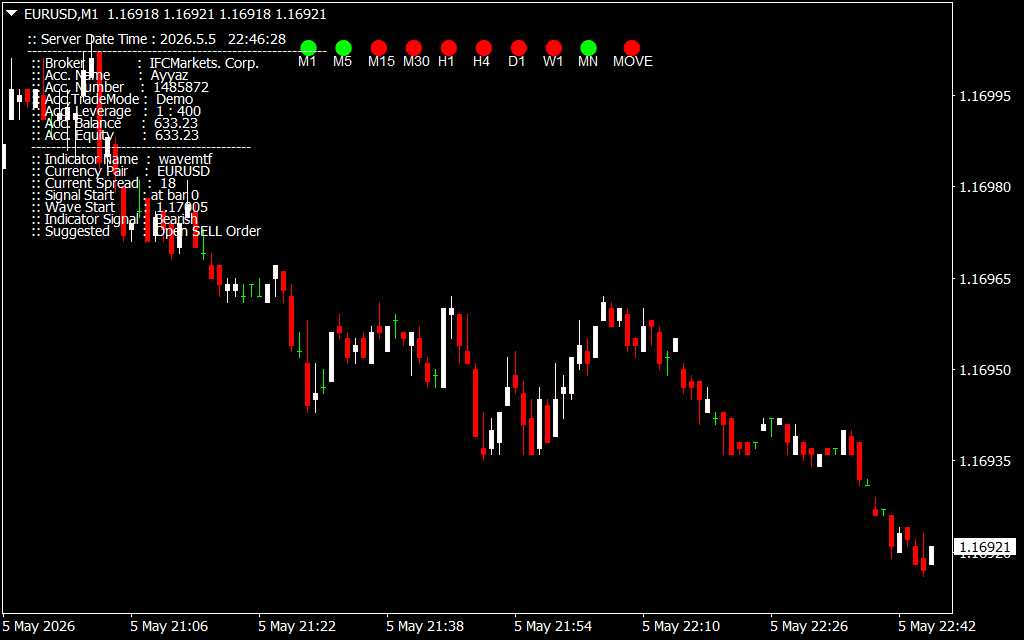
One of the biggest challenges for retail traders is "noise"—the small, erratic price movements that obscure the larger trend. The Wave Indicator M2 addresses this by utilizing a sophisticated multi-timeframe (MTF) dashboard. As seen on your chart, the indicator provides a series of status lights for timeframes ranging from M1 all the way up to the Monthly (MN) chart.
When these signals align—for example, when the majority of indicators from M15 to D1 turn red—it signals a high-concurrency Bearish wave. This alignment, often referred to as "confluence," is a cornerstone of professional trading, as it indicates that different groups of market participants are all moving in the same direction.
Key Features of Wave Indicator M2
- Real-Time Trend Dashboard: Get an instant snapshot of market sentiment across nine different timeframes without ever leaving your current chart.
- Actionable Trade Suggestions: The indicator includes an intelligent logic engine that interprets current data to provide specific suggestions, such as "Open SELL Order" when bearish conditions are met.
- Precision Entry Points: By identifying the "Wave Start" price, the indicator helps you time your entries at the very beginning of a new momentum shift rather than chasing an exhausted trend.
- Clean Information Display: The interface provides essential account and broker data alongside technical signals, ensuring you have all the facts needed for risk management in one place.
Strategic Application: Trading the Bearish Wave
Successful trading with the Wave Indicator M2 involves looking for synchronization. In a bearish scenario, the indicator tracks lower highs and lower lows to confirm a downward wave. When the "Indicator Signal" explicitly states "Bearish," it acts as a green light (or in this case, a red light) to look for shorting opportunities.
By filtering your trades so that you only sell when the higher-timeframe "MOVE" dots are red, you significantly increase your win rate. This strategy ensures you aren't just catching a minor pullback, but are riding a major market wave.
Conclusion
The Wave Indicator M2 is more than just a signal generator; it is a comprehensive market-reading system. By simplifying complex price data into an easy-to-read dashboard, it removes the emotional guesswork that often plagues traders. Whether you are a fast-paced scalper or a patient swing trader, the Wave Indicator M2 provides the structural clarity required to navigate the markets with professional precision.
2 Downloads
Last Update:
May 06, 2026 01:47 AM
Published:
Jan 27, 2026 02:53 AM
Category: