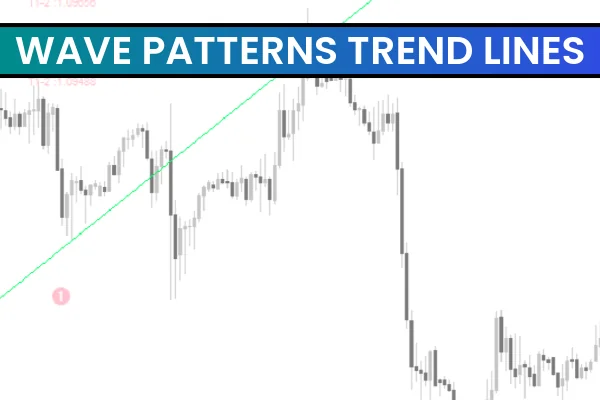
The Wave Patterns Trend Lines Indicator is a useful and popular forex trading tool designed for the MetaTrader 4 (MT4) platform. This free indicator is widely used by traders to identify trend lines, wave patterns, and important Market Structure points. By visually analyzing price highs and lows, the indicator helps traders make more informed and confident trading decisions.
Due to its clear visual output and ease of use, the Wave Patterns Trend Lines Indicator is suitable for both beginner and experienced traders. It provides valuable insight into market direction, helping traders better understand price behavior and potential future movements.
How the Wave Patterns Trend Lines Indicator Works
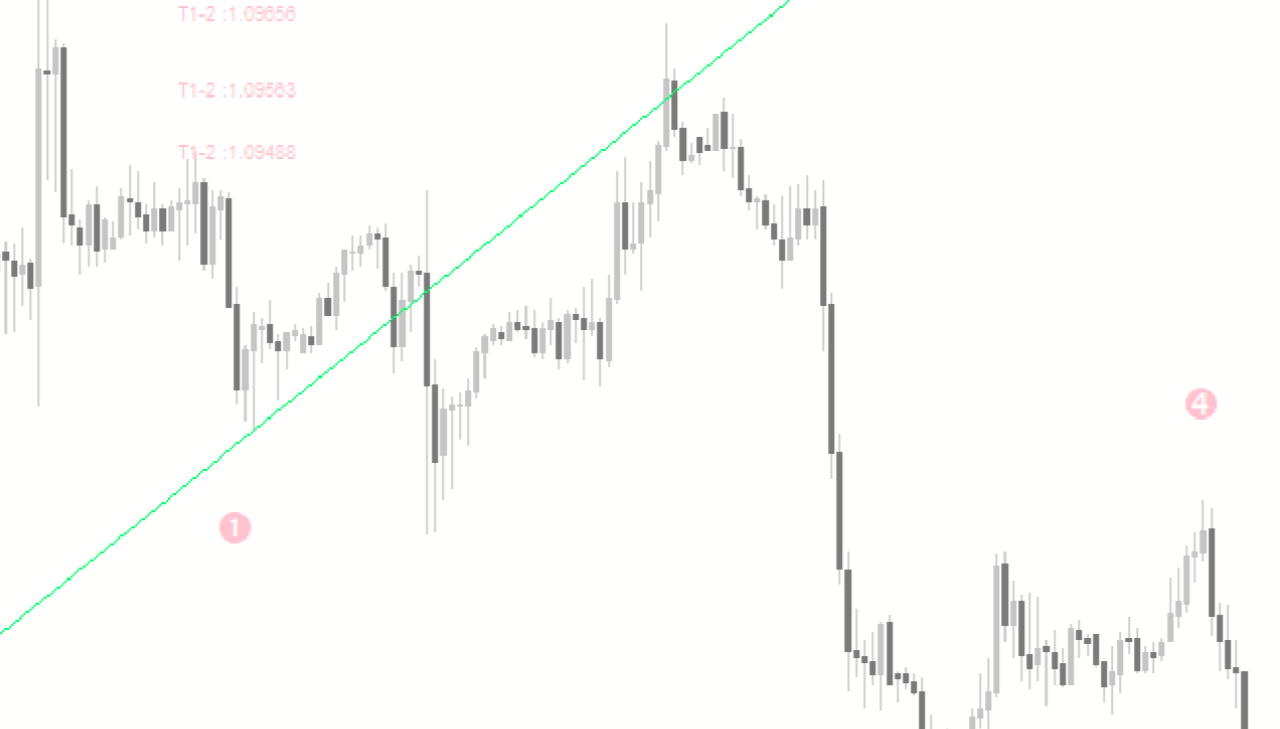
The Wave Patterns Trend Lines Indicator works by automatically detecting market highs and lows to plot trend lines and wave patterns directly on the price chart. These plotted structures allow traders to clearly see how price is moving within trends and waves.
By identifying wave formations, the indicator helps traders recognize Trend Continuation, market corrections, and possible reversals. This makes it easier to understand overall market structure and align trades with the dominant trend.
Key Features of Wave Patterns Trend Lines Indicator
Automatic Trend Line Drawing
The indicator automatically draws trend lines based on price movement, removing the need for manual analysis. This saves time and improves accuracy.
Wave Pattern Identification
Wave patterns help traders understand market cycles and price behavior. These patterns can signal potential continuation or reversal zones.
Support and Resistance Levels
By analyzing price waves and trend lines, traders can easily identify support and resistance areas where price is likely to react.
How to Use Wave Patterns Trend Lines Indicator
Installation and Setup
Download the Wave Patterns Trend Lines Indicator for MT4
Install it in your MetaTrader 4 platform
Apply the indicator to your preferred currency pair or asset
Adjust settings if needed to match your trading style
Trading Signals and Analysis
Trend Trading: Trade in the direction of the plotted trend lines
Breakout Opportunities: Watch for price breaking above or below trend lines
Reversal Points: Use wave patterns to anticipate possible market reversals
Example
On an EUR/USD H1 chart, the Wave Patterns Trend Lines Indicator plots clear upward trend lines and wave formations. Traders can use these signals to enter buy trades during pullbacks and exit near resistance levels. When trend lines break, traders can prepare for possible trend reversals or breakouts.
Advantages of Wave Patterns Trend Lines Indicator
Automatically identifies trend lines and wave patterns
Improves market structure and price action analysis
Helps identify support, resistance, and breakout levels
Suitable for Scalping, day trading, and swing trading
Free to download and fully compatible with MT4
By incorporating this indicator into a trading strategy, traders can reduce guesswork and improve overall trading accuracy.
Conclusion
The Wave Patterns Trend Lines Indicator MT4 is a valuable forex trading tool for identifying trends, wave patterns, and key market levels. Its automatic analysis and clear visual signals make it an excellent choice for traders looking to improve decision-making and trade with greater confidence. Visit IndicatorForest.com to download the Wave Patterns Trend Lines Indicator for free and enhance your MT4 trading strategy today.
FAQ
Wave Patterns Trend Lines identifies Elliott Wave patterns and draws trend lines automatically. It helps traders spot wave structures and use trend lines to identify potential trading opportunities.
Wave patterns identify market structure, help predict potential price movements, provide entry and exit points based on wave completion, and offer a systematic approach to analyzing price action.
Enter trades at wave completion points, trade in the direction of the main wave trend, use trend lines for entry timing, and target next wave level for profits.
Wave analysis provides structure to price movements, helps predict potential targets, offers clear entry and exit points, and combines pattern recognition with trend line analysis.
Combine with Fibonacci retracements for wave targets, use with momentum oscillators for confirmation, integrate with support/resistance levels, and combine wave analysis with trend indicators.
Published:
Dec 16, 2025 04:17 AM
Category: