Uncover Hidden Institutional Order Flow with Williams Accumulation Distribution
In the competitive landscape of retail foreign exchange trading, Price Action alone can often be deceptive. A currency pair might print a series of bullish candlesticks, giving the illusion of a strong upward trend, while institutional players are quietly distributing their positions and preparing to reverse the market. To avoid getting trapped on the wrong side of these sudden market rotations, smart money traders look underneath the surface to analyze volume and price pressure confluence. The Williams Accumulation Distribution indicator for MetaTrader is engineered to bridge this gap, revealing the true balance of power between buyers and sellers.
The Blueprint of Cumulative Market Pressure
Developed by legendary technical analyst Larry Williams, the Accumulation Distribution (A/D) model calculates whether market participants are actively accumulating (buying) or distributing (selling) an asset. Unlike basic momentum oscillators that only measure localized price velocity, this indicator quantifies the market’s true buying and selling pressure by evaluating where the asset closes relative to its daily range.
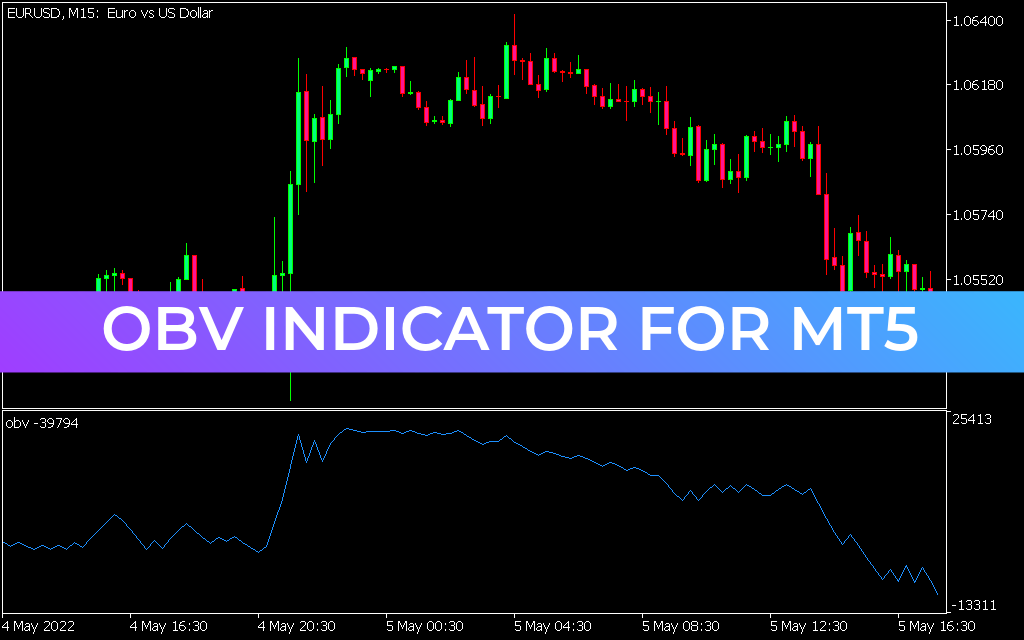
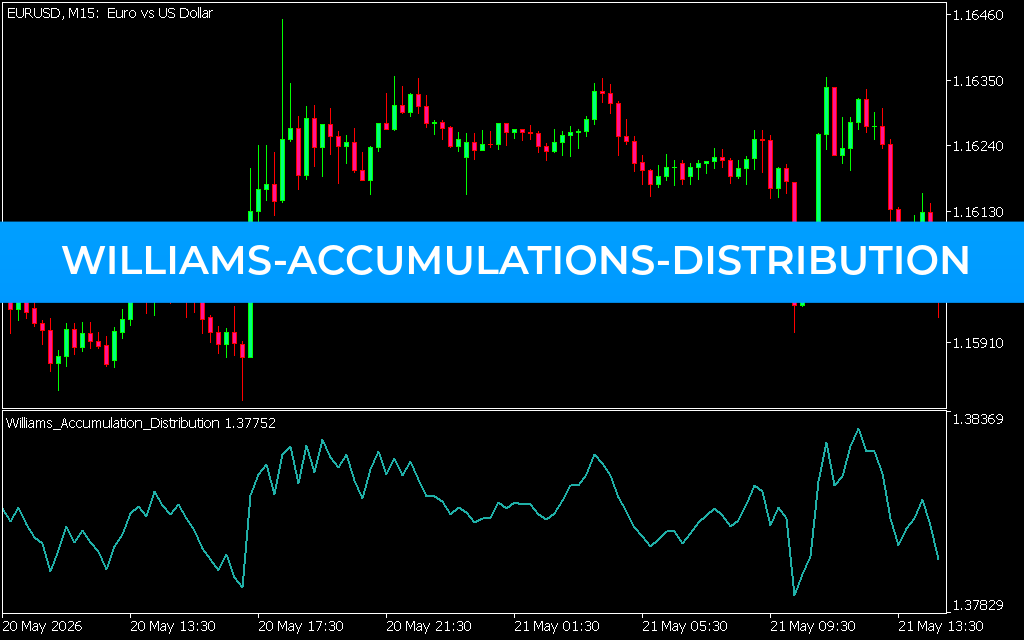
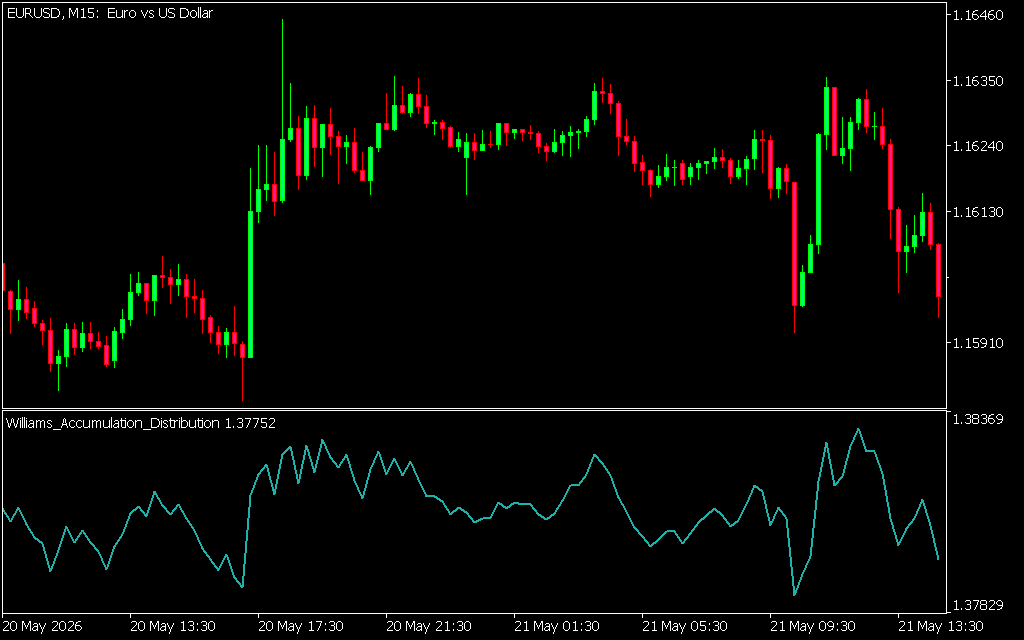
As displayed on the EURUSD 15-minute workspace, the indicator functions as a specialized structural curve within a dedicated sub-window immediately below the main candlestick panel:
- The Cumulative Equilibrium Wave (Light Blue Line): This primary curve represents the running total of daily price-pressure metrics. A rising light blue line confirms steady institutional accumulation, while a falling line signals aggressive distribution.
- The Smoothed Signal Tracking Vector (Purple Line): Operating alongside the primary wave, this moving average line smooths out sudden intraday spikes, giving day traders and scalpers an objective visual guide to macro-driven trend directions.
- Price and Indicator Divergence Panels: The true analytical edge of this layout occurs when the movement of the light blue line decouples from raw price action, highlighting upcoming market inflections before they appear on the chart.
Key Trading Features and Strategic Advantages
- Accurate Smart Money Tracking: Instantly exposes whether a market move is backed by true institutional volume or driven by temporary retail speculation.
- Advanced Divergence Detection: Flags high-probability trend reversals early by identifying discrepancies between price action and cumulative order flow.
- Maintains Workspace Hygiene: Keeping the mathematical plot confined to a bottom pane ensures your primary panel stays clean for tracking support zones or order blocks.
- Optimized for Intraday Strategy Filters: Highly effective on M15 charts for filtering out false breakouts during high-volume European and New York session openings.
Execution Strategies Using Williams Accumulation Distribution
To transform this institutional tracking utility into a reliable mechanical system, integrate its line crossovers into a rule-based execution routine:
- The Classic Bullish Divergence Setup: Monitor the indicator when price sets a fresh structural swing low. If the price prints a lower low but the light blue accumulation curve creates a higher low, it reveals that institutional buying pressure is building secretly. Prepare for an aggressive long entry.
- The Signal Line Momentum Trigger: In active trend phases, watch for the light blue vector to cross cleanly over the purple moving average guide. A bullish cross from underneath confirms accelerating buy-side volume, validating a continuation trade.
- Calibrated Capital Protection: Anchor your protective stop-losses slightly beyond the recent structural swing high or swing low printed on your main candlestick chart. This keeps your downside risk completely capped while letting your position run with institutional momentum.
Last Update:
May 22, 2026 20:48 PM
Published:
Jan 17, 2026 14:41 PM
Category: