The Xmaster Formula Indicator for MT4 is a powerful trend-following tool that combines multiple technical indicators behind the scenes, including Moving Averages, RSI, and MACD. While the engine is complex, the output is simple and actionable: BUY or SELL arrows and a BULLISH or BEARISH Trend Indicator.
This combination makes it ideal for both beginner and advanced forex traders who want a reliable tool for identifying trend direction and potential entry points. The indicator works across intraday charts (M1, M5, M15, H1) as well as daily, weekly, and monthly charts, making it versatile for multiple trading strategies. Additionally, the Xmaster Formula Indicator is free to download and easy to install.
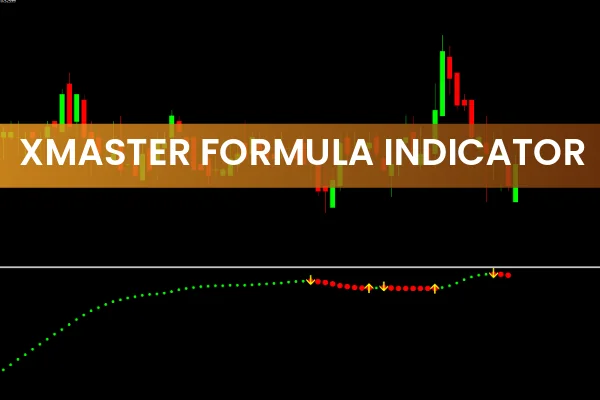
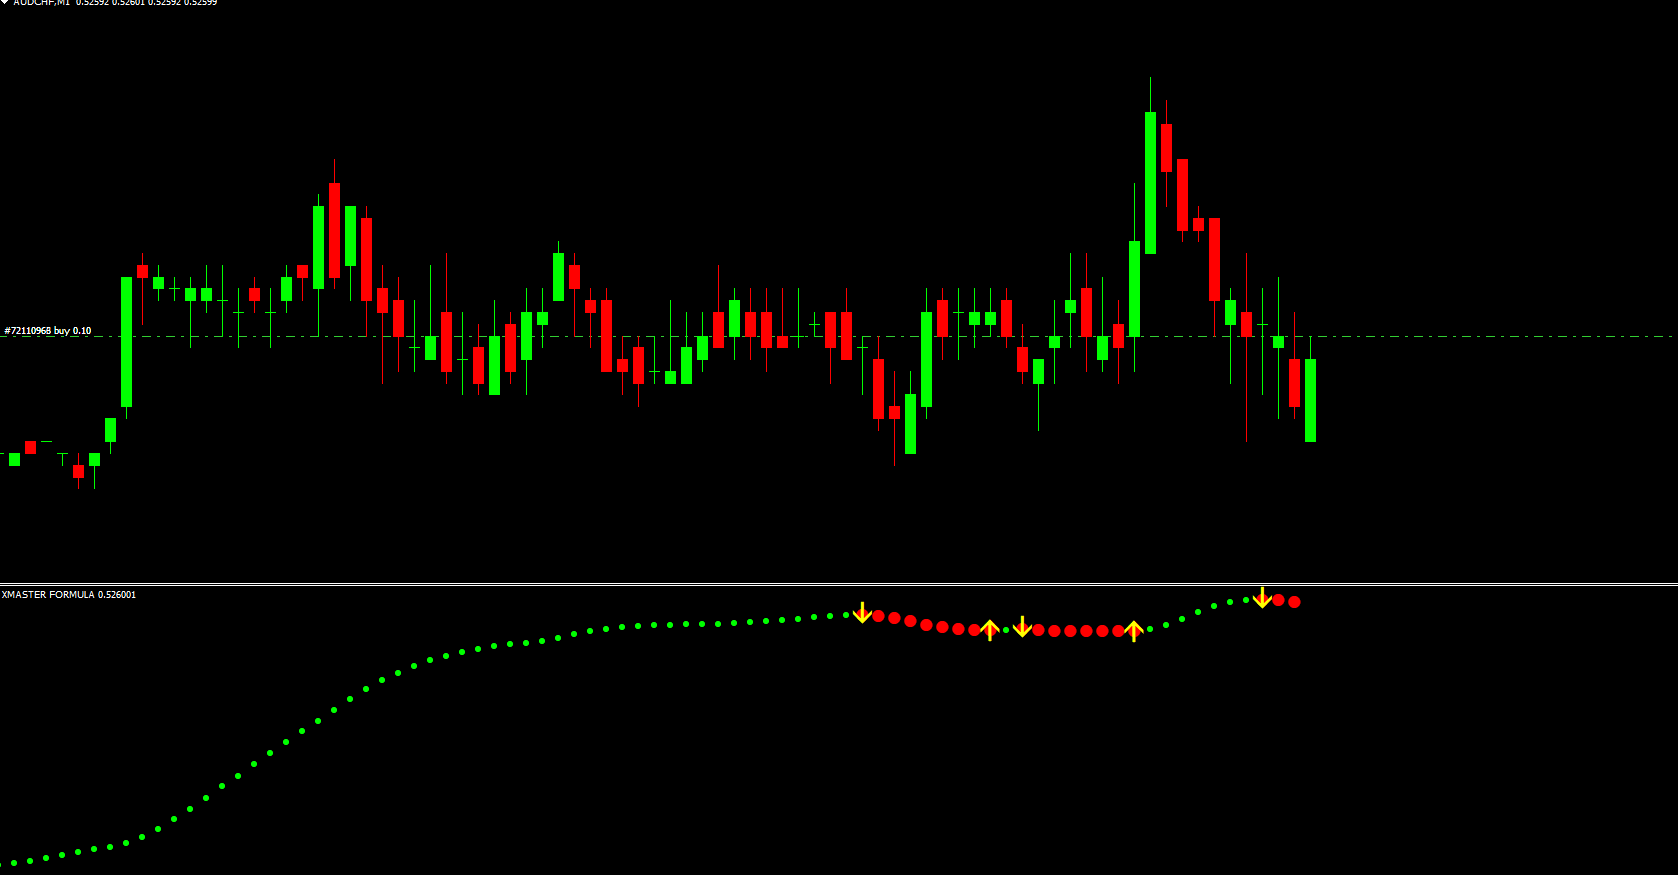
Xmaster Formula Indicator MT4 Trading Signals
On the EURUSD H1 chart, the Xmaster Formula Indicator displays:
BUY and SELL arrow signals in YELLOW
BULLISH trend represented by LIME dots
BEARISH trend represented by RED dots
The arrows appear in a separate window below the price chart, providing traders with a clear visual cue without cluttering the main chart.
How to Use Buy Signals
A YELLOW arrow pointing upwards appears.
Confirm that the indicator shows LIME dots, signaling a bullish trend.
Place the BUY order with a stop loss below the previous swing low.
Exit the trade when the opposite arrow appears or trend conditions change.
How to Use Sell Signals
A YELLOW arrow pointing downwards appears.
Confirm that the indicator shows RED dots, signaling a bearish trend.
Place the SELL order with a stop loss above the previous swing high.
Take profit at the opposite arrow or trend reversal signal.
For best results, always wait for confirmation from both the arrow and dot color. If only one signal appears, it is recommended to wait until both align before entering a trade.
Multi-Timeframe (MTF) Strategy
The Xmaster Formula Indicator is optimized for trend-following strategies and works exceptionally well with multi-timeframe analysis:
Follow the trend on higher timeframes (H4, Daily)
Identify entry points on lower timeframes (M15, H1)
Trade in the direction of the established trend for higher probability trades
Using this top-down approach, traders can improve timing and minimize false signals.
Trading Tips for Xmaster Formula Indicator
Trendlines and Support/Resistance: Always consider existing trendlines, channels, or support/resistance levels to filter signals.
Avoid Overtrading: Wait for arrow and dot confirmation to ensure strong trend alignment.
Adjust Timeframes: The indicator is flexible and can be used on multiple timeframes simultaneously to enhance signal accuracy.
Risk Management: Place stop losses according to previous swing highs/lows and calculate position size based on your risk tolerance.
By combining the simplicity of arrow signals with color-coded trend confirmation, the Xmaster Formula Indicator reduces chart clutter while helping traders focus on high-probability trades.
Conclusion
The Xmaster Formula Indicator for MT4 is a trend-following Forex Indicator that provides reliable BUY and SELL signals using arrows and color-coded trend dots. It is easy to use, works on all major timeframes, and supports multi-timeframe trading strategies.
Traders should also consider established trendlines, support, resistance, and channels for optimal results. With its simple interface, clear signals, and free availability, the Xmaster Formula Indicator is an excellent tool for both novice and professional forex traders.
FAQ
4 Downloads
Published:
Nov 29, 2025 10:52 AM
Category: