Master Market Structure: Ultimate Guide to the ZZZ Indicator
For retail and professional traders alike, analyzing raw Price Action can frequently feel chaotic. It is easy to get caught up in every minor candlestick wiggle, leading to premature trade entries, tight stops getting triggered unnecessarily, or missing the broader market trend entirely. To trade successfully, you must learn to filter out the noise and identify the market's true structural swing highs and swing lows.
While some technicians map these coordinates manually, human bias often skews the data. That is why systematic traders rely on the ZZZ Indicator (commonly known as the custom ZigZag algorithm). By connecting major price pivots with clean geometric lines, this indicator maps Market Structure and trend direction with flawless mathematical objectivity.
What is the ZZZ Indicator?
The ZZZ Indicator is an advanced structural charting software designed to simplify trend tracking and pattern recognition. The underlying script filters out price fluctuations that are smaller than a user-defined percentage or pip threshold. It only registers a new line when the asset makes a substantial contrarian move.
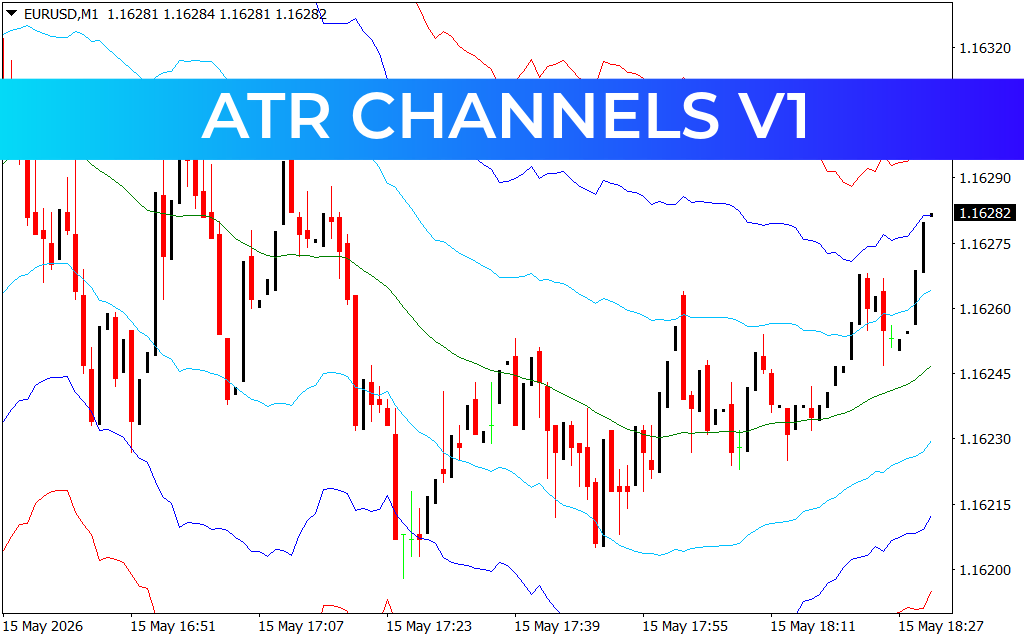
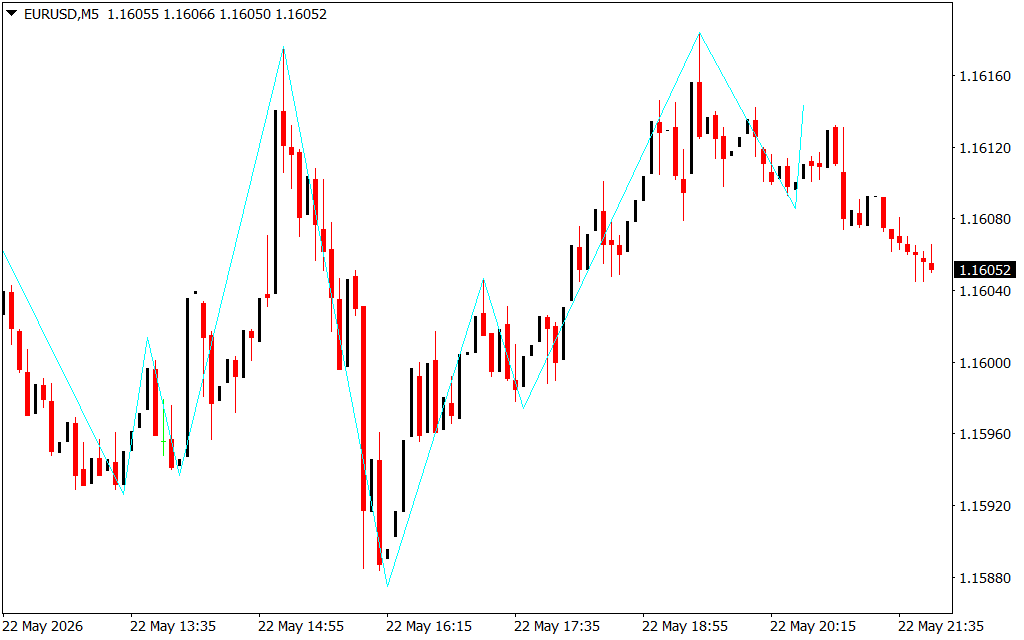
As shown in the EUR/USD 5-minute (M5) chart above, the indicator overlays a continuous, sharp light-blue line across the candlesticks. Instead of forcing you to guess where a market cycle starts and ends, it visually groups price expansions and retracements into an easy-to-read layout. This clean framework makes it an invaluable utility for intraday scalpers and long-term swing traders alike.
Key Features and Strategic Advantages
- Flawless Noise Filtering: Smooths out minor intraday market spikes, allowing you to focus purely on macroscopic waves and real trend legs.
- Automated Swing Detection: Instantly identifies structural swing highs and swing lows without introducing human subjectivity or hesitation.
- Geometric Pattern Recognition: Provides a clean foundation for mapping classic technical formations, including Head and Shoulders, Double Tops, and complex Elliott Wave counts.
- Multi-Timeframe Efficiency: Functions perfectly on any chart horizon, helping you visually align high-frequency M5 execution points with higher-timeframe trends.
How to Trade with the ZZZ Indicator
Integrating the ZZZ structural framework into your active trading system simplifies mechanical execution across two popular disciplines:
- Smart Money Concepts & Market Structure Shifts (MSS): Use the peaks and valleys drawn by the indicator to track higher highs (HH) and higher lows (HL) in an uptrend. When price breaks cleanly below the last low established by the blue line, it signals an immediate market structure shift, offering an optimal environment to hunt for short positions.
- Dynamic Support And Resistance: The turning points marked by the indicator represent zones where heavy institutional buying or selling occurred. Treat these historical pivot tips as reliable horizontal support and resistance levels for future price reactions.
For maximum accuracy, avoid trading the final line segment blindly, as it dynamically updates until the current candle cycle closes. Instead, combine the completed structural peaks with volume profiles, Fibonacci retracements, or oscillator confirmations.
3 Downloads
Last Update:
May 24, 2026 02:50 AM
Published:
Jan 15, 2026 19:06 PM
Category: