Mastering Market Volume: The Accumulation Distribution Q1 Indicator for MT4
In the world of technical analysis, Price Action is only half of the story. To truly understand the conviction behind a market move, a trader must look at volume. The Accumulation Distribution Q1 indicator for MetaTrader 4 (MT4) is a premier volume-based tool designed to reveal whether a currency pair is being "accumulated" by big institutional players or "distributed" to the retail crowd. By bridging the gap between price and volume, this indicator helps traders identify high-probability trend continuations and early-stage reversals.
The Philosophy of Accumulation and Distribution
The core logic of the Accumulation Distribution Q1 indicator is based on the idea that the location of the close relative to the high and low of the bar determines the strength of the buying or selling pressure. If a pair consistently closes near its daily high on increasing volume, it indicates heavy accumulation. Conversely, closing near the lows suggests institutional distribution.
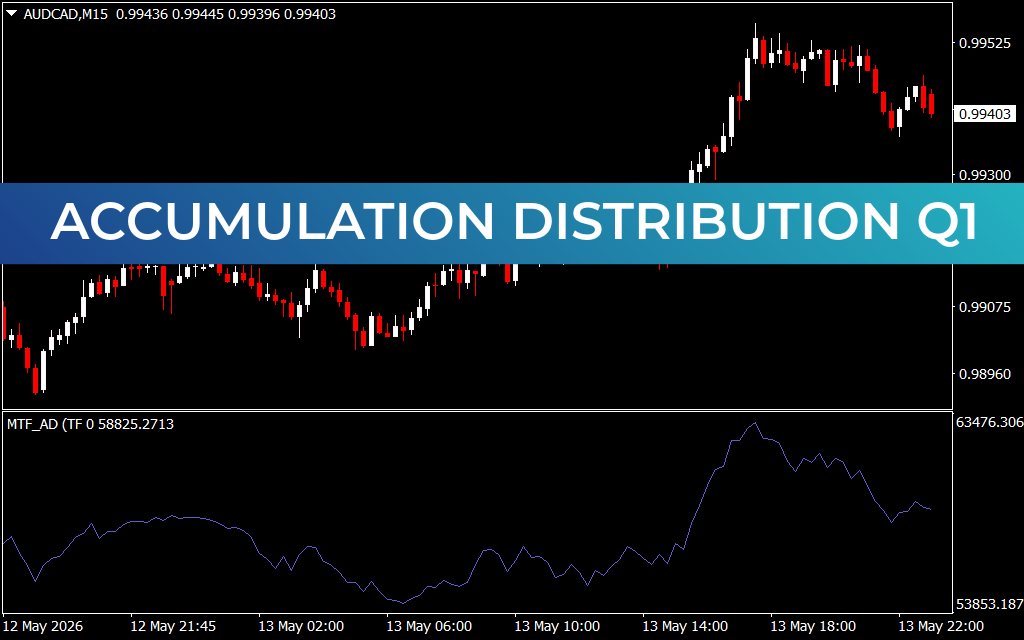
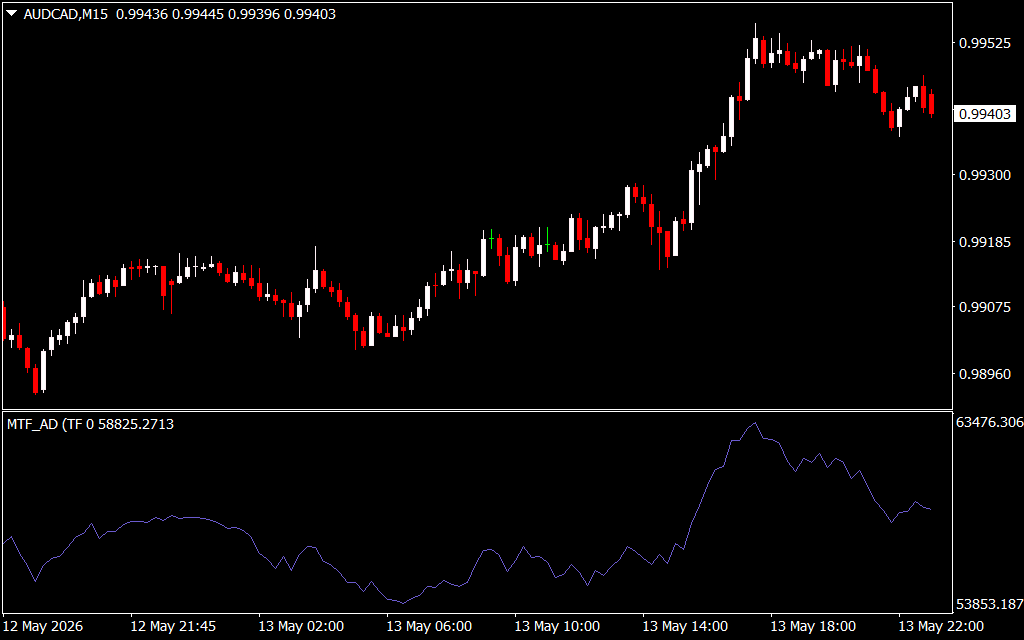
As illustrated in the AUD/CAD M15 chart, the Accumulation Distribution Q1 manifests as a continuous line in a separate indicator window. Unlike standard volume bars that can be chaotic, this indicator creates a smooth, cumulative line that maps the true flow of money into or out of the asset.
Why the Q1 Version is a Trader's Choice
While the standard Accumulation Distribution line is a classic, the Q1 evolution provides several key enhancements for modern traders:
- Institutional Footprint Tracking: It is specifically tuned to highlight the activity of large-volume traders, making it easier to spot "Smart Money" entries before they result in a massive price breakout.
- Divergence Detection: The most powerful signal of the Accumulation Distribution Q1 is divergence. If the price of AUD/CAD is making new highs but the indicator line is sloping downward, it warns that the trend lacks volume support and a reversal is imminent.
- Trend Confirmation: In a healthy trend, as seen in the latter half of the provided chart, the Q1 line should move in tandem with the price. This confirmation gives traders the confidence to hold winning positions for maximum profit.
- Non-Repainting Reliability: This indicator is built with stable code that does not repaint past values, ensuring that your backtesting and real-time execution are based on accurate, permanent data.
Strategic Application
To maximize the effectiveness of the Accumulation Distribution Q1, traders should look for volume breakouts. When the indicator line breaks a long-term resistance level before the price does, it acts as a leading indicator of a coming rally.
For scalpers and day traders on the M15 timeframe, the Q1 line helps filter out "fake" breakouts. If price pierces a resistance level but the Accumulation Distribution line remains flat, the move likely lacks the volume required to sustain itself. By using this tool as a secondary filter, you can significantly increase your win rate and avoid the common traps of low-liquidity market sessions.
2 Downloads
Last Update:
May 14, 2026 02:27 AM
Published:
Jan 22, 2026 14:52 PM
Category: