Mastering Volatility: The ATR Channels Indicator for MT5
In the high-velocity world of Forex trading, price movement is rarely linear. It breathes, expands, and contracts based on market volatility. While many traders rely on static Support And Resistance, professional technical analysts use volatility-adjusted tools to understand market boundaries. The ATR Channels indicator for MetaTrader 5 (MT5) is a premier solution that envelopes Price Action within dynamic bands based on the Average True Range (ATR), providing a clear map of overextended and equilibrium zones.
The Logic of Volatility-Based Channels
Unlike standard Bollinger Bands, which use standard deviation, the ATR Channels indicator utilizes the Average True Range to calculate the distance of the bands from a central baseline. Because ATR measures the actual range of price movement over a set period, these channels adapt more organically to the "real" volatility of a pair like EUR/USD.
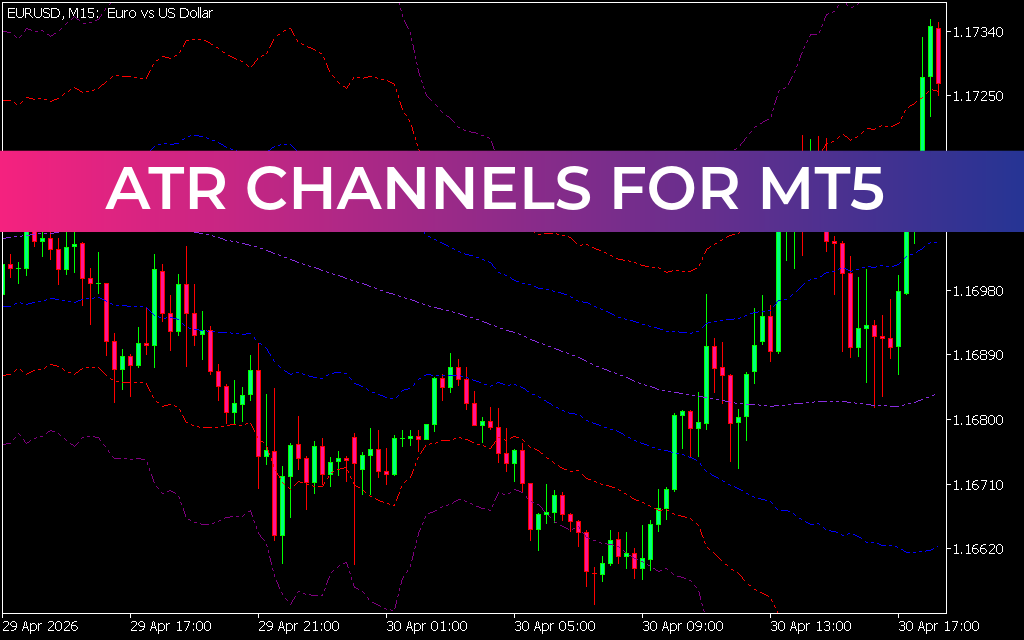
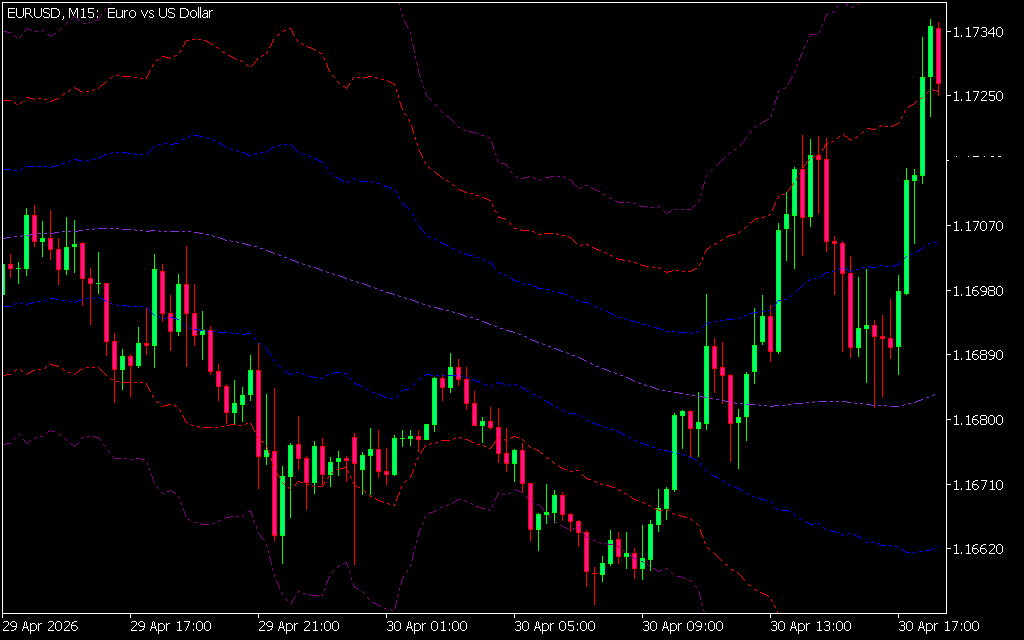
As illustrated in the EUR/USD M15 chart, the indicator plots several layers of dashed bands:
- The Inner Channels (Blue): These represent the standard "value" area where price spends the majority of its time during consolidation or steady trends.
- The Outer Channels (Red and Magenta): These represent extreme volatility thresholds. When price reaches or pierces these outer boundaries, it suggests the market is overextended (overbought or oversold) and a mean-reversion move or a period of consolidation is likely imminent.
Key Strategic Advantages for MT5 Traders
Integrating ATR Channels into your trading workstation offers several mechanical advantages:
- Objective Exit Targets: Many traders struggle with knowing when to take profits. The outer ATR bands serve as logical exit points, as they represent the mathematical limits of "normal" price expansion for that timeframe.
- Volatility-Adjusted Stop Losses: By observing the width of the channels, traders can place stop-losses outside of the current volatility "noise," significantly reducing the chances of being stopped out by minor market fluctuations.
- Dynamic Market Structure: During a strong trend, as seen in the latter half of the provided chart, the channels slope upward or downward. A "riding the bands" scenario indicates strong momentum, while a horizontal channel suggests a range-bound market perfect for mean-reversion strategies.
- MT5 Multi-Timeframe Precision: Specifically optimized for MT5, the indicator maintains its accuracy across all timeframes, from the M1 scalper's view to the Daily swing trader's perspective.
How to Trade the ATR Channels
The most effective way to utilize this tool is to look for "extreme touches." When a candle closes outside the magenta outer channel, it signals that the price has moved significantly beyond its average range. In the EUR/USD example, the sharp bullish spike toward 17:00 pushed price into the upper extreme.
Savvy traders use these moments to look for reversal patterns or to scale out of winning long positions. Conversely, during a steady trend, the inner blue lines often act as dynamic support; a retracement to the center followed by a bounce is a classic "trend continuation" entry.tance levels in your trades today.
Last Update:
May 14, 2026 02:15 AM
Published:
Jan 22, 2026 14:01 PM
Category: