Master Market Volatility with the ATR Value Indicator
In the high-stakes world of technical trading, understanding market volatility is the foundation of a successful risk management strategy. While many traders focus exclusively on price direction, professional market participants prioritize how much the price is moving. The ATR Value Indicator is an indispensable technical tool designed to quantify market volatility in real-time, enabling you to set smarter stop-losses and mathematically sound profit targets.
What is the ATR Value Indicator?
The Average True Range (ATR) is a non-directional Volatility Indicator originally introduced by J. Welles Wilder Jr. Unlike momentum oscillators that signal overbought or oversold states, the ATR measures the "true range" of price movement over a defined period. The ATR Value Indicator simplifies this complex calculation by presenting a precise numerical value directly on your trading chart, eliminating the need for manual calculations or complex sub-window interpretations.
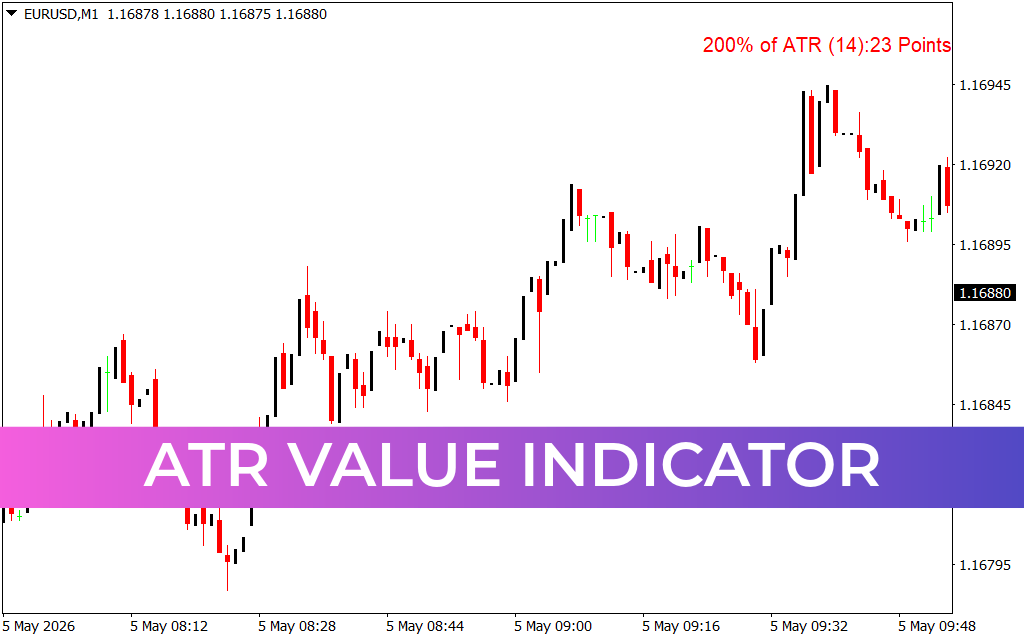
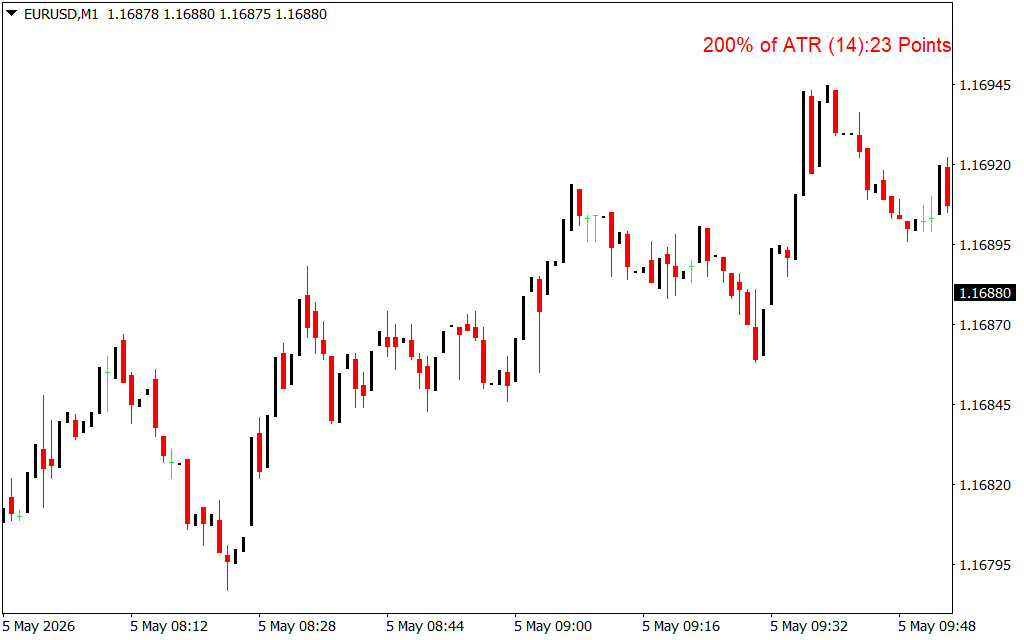
As demonstrated in the provided image, the indicator displays vital data in a clean, on-screen text format in the upper right corner. For example, it can show values like "200% of ATR (14): 23 Points." This real-time update provides the "heartbeat" of the market for your specific timeframe, such as the M1 chart shown in the example.
Key Features and Benefits
- Objective Volatility Measurement: It provides a mathematical value for price movement, allowing you to distinguish between a "quiet" market and a high-energy breakout.
- Dynamic Stop-Loss Placement: Many professionals use a "multiple" of the ATR (such as the 200% shown in the chart) to set stop-losses. This ensures your stops are wide enough to survive standard market noise but tight enough to protect your capital.
- Realistic Target Setting: By knowing the current ATR Value, you can set Take Profit levels that the market is actually capable of reaching within your chosen trading session.
- Clean On-Chart Display: By placing the numerical value in the corner of your screen, the indicator saves valuable chart space, keeping your workspace focused on Price Action rather than cluttered sub-windows.
How to Trade with the ATR Value Indicator
The ATR Value Indicator serves as the ultimate "filter" for any trading strategy. If you are a scalper on the M1 chart, seeing an ATR value of 23 points (as seen in the image) tells you exactly how much the pair is currently fluctuating on average.
Furthermore, it is a critical tool for Trend Following. During a strong trend, volatility often increases. If the ATR value begins to spike significantly beyond its historical average, it may signal an exhaustion phase, alerting you to tighten your trailing stops. Conversely, an exceptionally low ATR value indicates a period of consolidation, which often precedes a major market breakout.
Why Every Trader Needs ATR Value
Technical trading is fundamentally about managing risk. If you use a fixed stop-loss (e.g., always 20 pips), you will inevitably be stopped out prematurely when volatility rises. The ATR Value Indicator allows your strategy to evolve dynamically with the market. Whether you are trading major Forex pairs, gold, or indices, this indicator provides the data-driven clarity required to manage risk like a professional.
3 Downloads
Last Update:
May 05, 2026 15:51 PM
Published:
Jan 27, 2026 20:09 PM
Category: