Navigating Intraday Reversals with Automated Structural Levels
Day trading highly liquid currency pairs like the EUR/USD requires an objective, mathematical map of Market Structure. On the 5-minute (M5) chart, price action constantly transitions through different volatility regimes, switching from tight consolidation boundaries to sharp expansion vectors. Without clear structural boundaries, retail traders frequently get caught chasing price at the absolute top of a range or selling at the absolute floor.
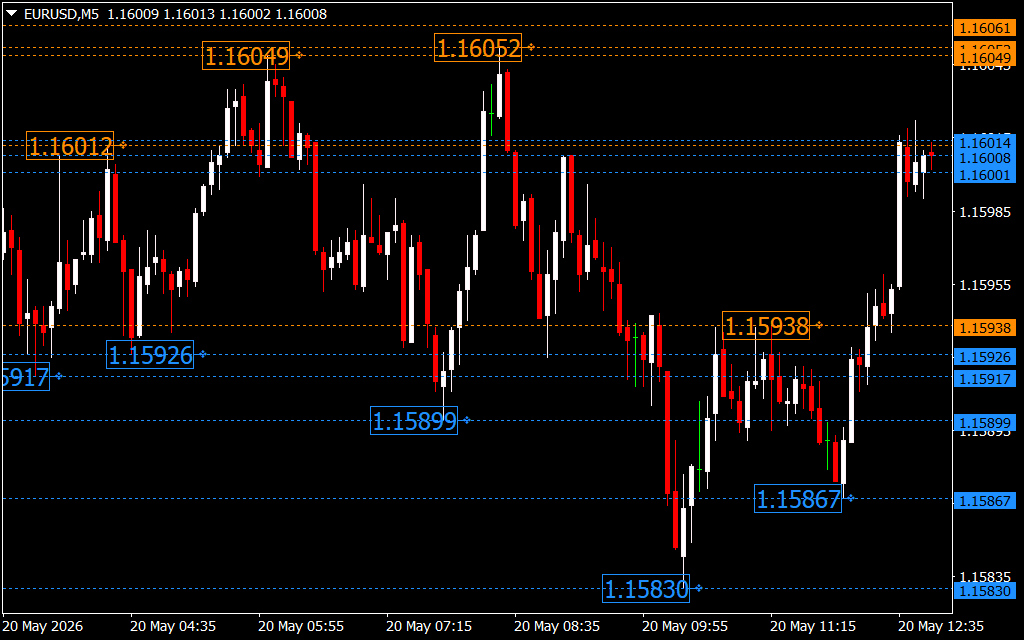
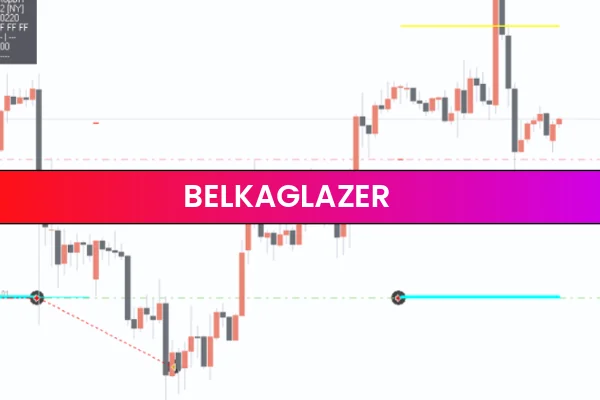
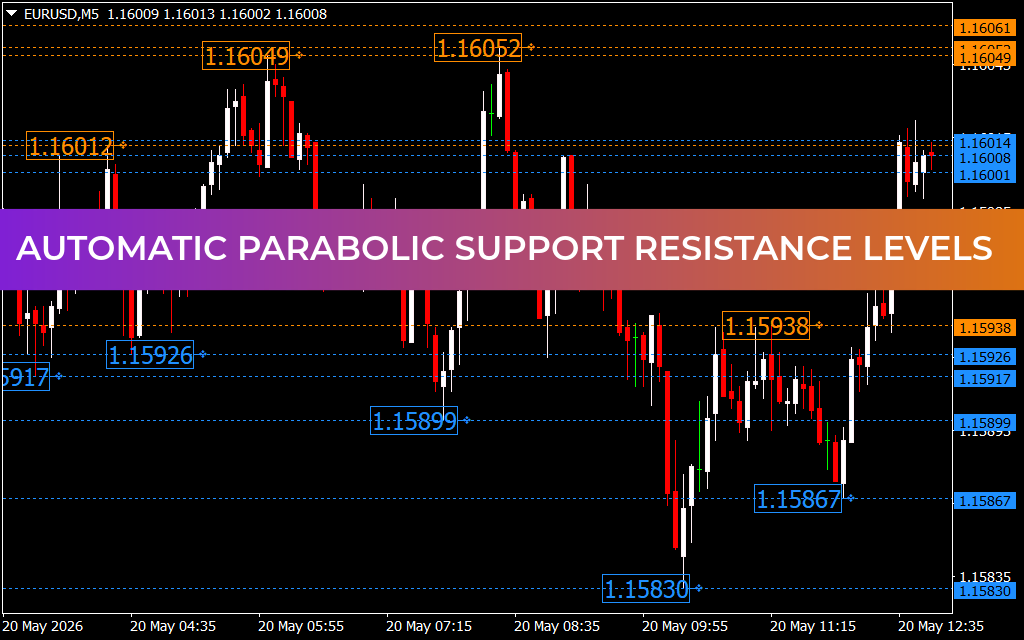
Looking closely at the price action on May 20th, the EUR/USD exhibited a prominent markdown phase, breaking down from local distribution areas to establish a structural low near 1.15830. Following this liquidity hunt, the asset began to compress, forming a distinct horizontal accumulation channel before staging an aggressive, high-momentum recovery back toward the 1.16014 level. To navigate these rapid shifts with institutional precision, mechanical mathematical modeling is required. This is precisely where the predictive nature of automated Support And Resistance levels changes the game.
The Power of Automated Mathematical Levels
The technical configuration laid out across this session illustrates the power of the Automatic Parabolic Support Resistance Levels indicator. Unlike traditional, static horizontal zones that require manual updating, this specialized utility dynamically tracks historical price clusters, mathematical peaks, and institutional liquidity pools to draw real-time corridors directly on your chart:
- The Supply Overlays (Orange Labels): The upper thresholds plotted at 1.16012, 1.16049, and 1.16052 mark structural order blocks where sellers previously took control. When price pushes into these orange resistance corridors, it flags key distribution zones where traders should look for candlestick exhaustion or consider securing profits on long positions.
- The Demand Floors (Blue Labels): The lower horizons mapped out at 1.15899, 1.15867, and the ultimate session floor at 1.15830 act as institutional buying magnets. When the EUR/USD sweeps these blue support parameters and fails to sustain a breakdown, it signals extreme seller exhaustion, offering a low-drawdown entry point right before a V-shaped market reversal.
By framing price movement inside these automated mathematical grids, traders can systematically eliminate subjective bias from their technical workflow.
Optimizing Your Platform for High-Velocity Execution
Manually drawing lines across changing timeframes introduces operational errors and mental lag. Utilizing an advanced automated script plots these critical horizontal layers across your charts instantly, leaving you free to focus purely on order execution. The customizable framework allows you to adapt individual level visibility, fine-tune mathematical sensitivities, and receive instant push notifications the exact moment a major structural key level is tested. Integrating this robust technical analysis overlay into your MetaTrader infrastructure provides an undeniable competitive edge—allowing you to pinpoint institutional turning points and scale your trading portfolio with absolute confidence.
8 Downloads
Last Update:
May 20, 2026 15:58 PM
Published:
Jan 18, 2026 19:00 PM
Category: