Trading Continuation Explosions with the Flag Pennant Patterns Indicator
In the financial markets, Price Action flows through alternating phases of explosive extension and quiet consolidation. While many retail traders mistakenly attempt to fade sharp trends by searching for tops and bottoms, professional technical analysts look for specific geometric structural pauses that signal institutional orders are accumulating for the next macro wave. Among these continuation structures, none are more statistically powerful than flags and pennants. The Flag Pennant Patterns indicator automates the identification of these high-probability structures directly within your trading platform.
What are Flag and Pennant Patterns?
Flags and pennants are short-term continuation chart patterns that form when an asset experiences a sharp, near-vertical price movement (known as the "flagpole"), followed by a temporary, orderly consolidation phase (the "flag" or "pennant").
- The Flag Pattern: Features a consolidation zone framed by two parallel, sloping trendlines that run counter to the initial sharp trend.
- The Pennant Pattern: Appears as a small, symmetrical triangle where the Support And Resistance trendlines converge tightly toward an apex point.
Both formations reflect a brief period of market equilibrium where profit-taking is met by aggressive institutional buyers or sellers adding to their positions. Once this brief compression ends, the market breaks out decisively, typically extending for a distance equal to the height of the original flagpole.
Visualizing the Automated Chart Diagnostics
Manually locating and drawing geometric trendlines across multiple assets and timeframes can be exhausting and subjective. The Flag Pennant Patterns indicator completely resolves this by scanning your active workspace using multi-bar structural logic and automatically drawing validated patterns onto your main price chart.
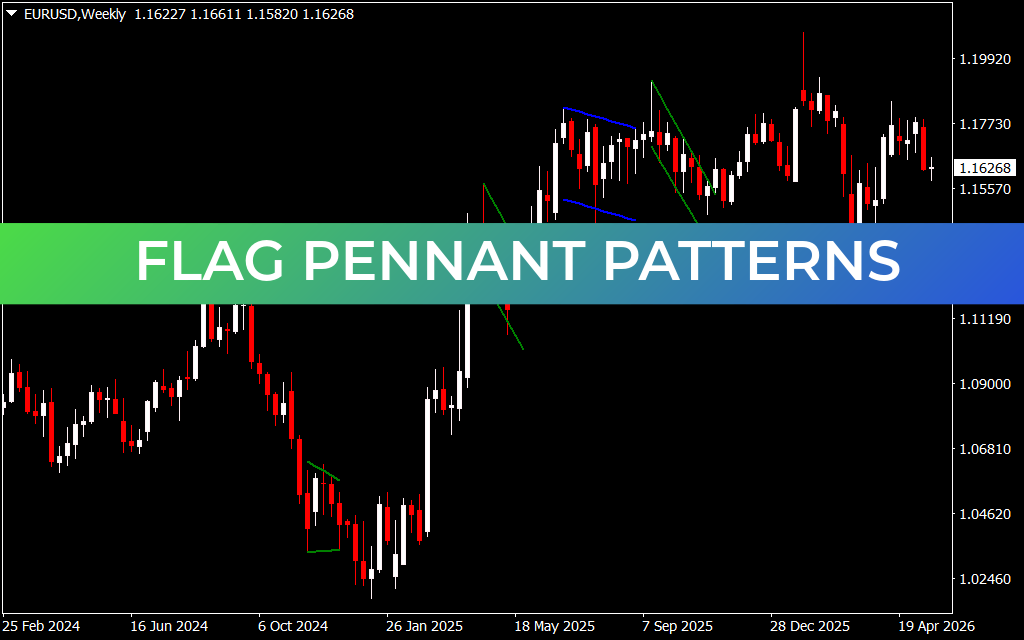
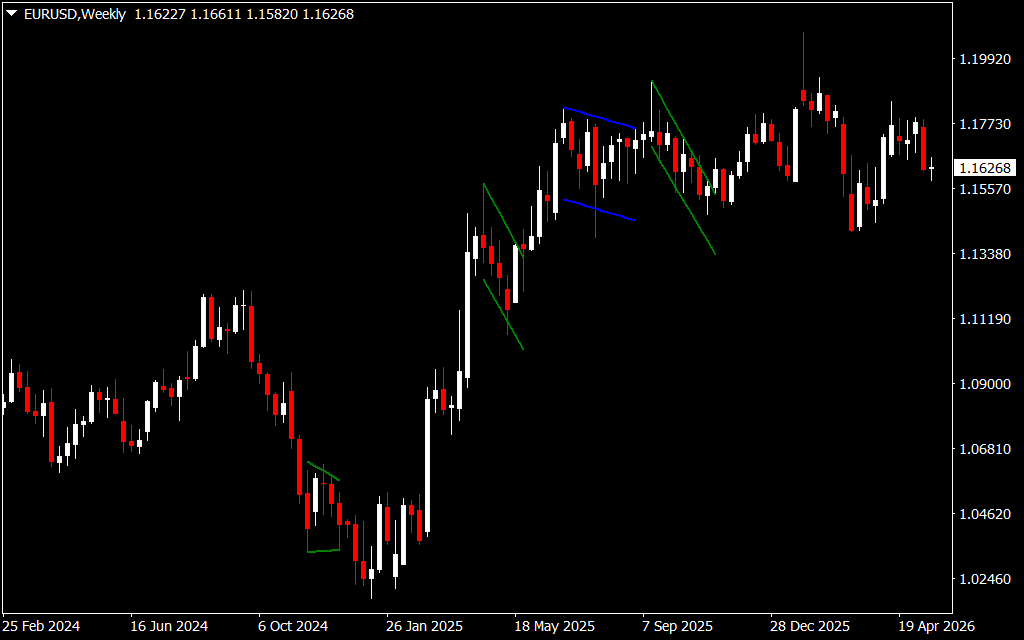
As shown on a macro weekly (Weekly) chart for major currency pairs like the EUR/USD, the indicator tracks these core structural setups:
- Bullish Continuations (Green/Blue Converging Lines): When a dominant macro uptrend pauses, the indicator frames the consolidation using clean geometric boundaries. A breakout above the upper resistance boundary confirms that institutional buying volume has re-entered the market, validating long-entry strategies.
- Bearish Continuations (Sloping Trendlines): During a severe multi-week markdown, the indicator highlights temporary upward retracements or bear pennants. A definitive breakdown past the lower support boundary alerts technical analysts to prepare for rapid downward extensions or short-selling continuation setups.
Advanced Strategic Application
To maximize the mathematical win rate of the Flag Pennant Patterns indicator, implement a systematic execution strategy:
- The Flagpole Measurement Rule: Calculate the height of the vertical impulse wave that preceded the pattern formation. Use this exact distance to project a highly objective take-profit target starting from the eventual breakout point.
- Multi-Timeframe Trend Confirmation: Only execute breakouts that align perfectly with your higher-timeframe trend compass. If the daily and weekly Market Structure is heavily bullish, focus exclusively on trading breakouts from bullish flag formations while filtering out counter-trend setups.
By removing the subjectivity from drawing chart geometry, the Flag Pennant Patterns indicator simplifies your daily analysis, letting you trade explosive market expansions with absolute rule-based confidence.
2 Downloads
Last Update:
May 21, 2026 02:45 AM
Published:
Jan 18, 2026 13:41 PM
Category: