The Fractal Support And Resistance Indicator for MT5 is a powerful tool for forex traders seeking multi-timeframe (MTF) support and resistance levels on a single chart. By combining levels from multiple timeframes, traders can identify stronger and more reliable zones, helping to improve trade accuracy and market analysis.
How the Fractal Support and Resistance Indicator Works
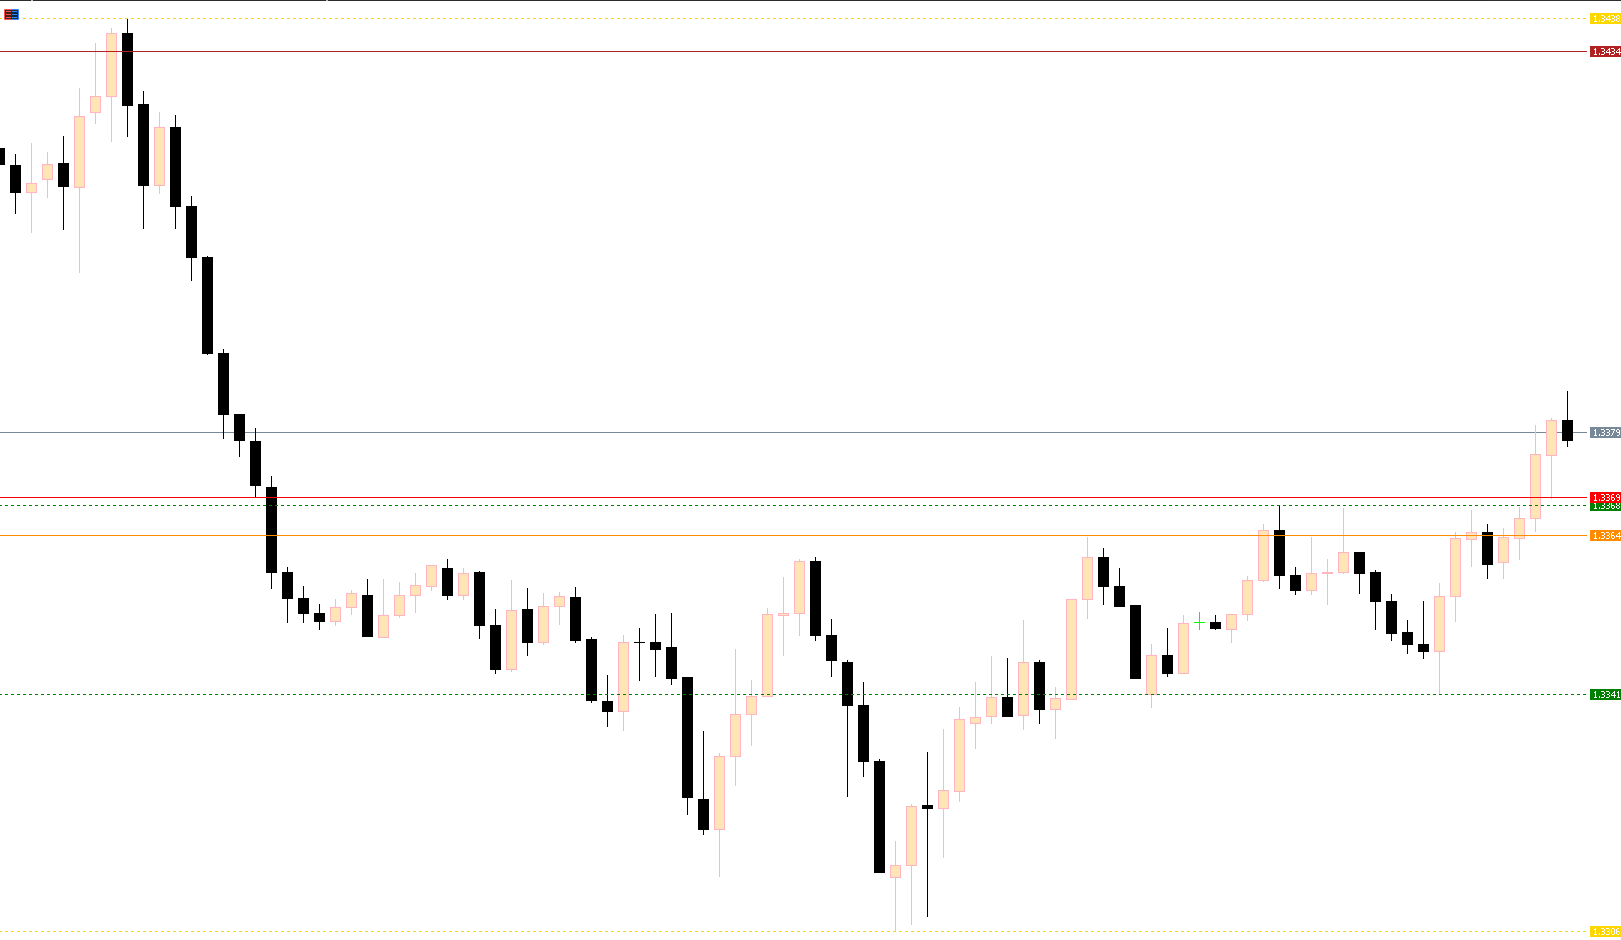
The indicator highlights support and resistance levels from multiple timeframes:
Support Levels: Shown as blue lines, indicating areas where buyers dominate.
Resistance Levels: Shown as red dotted lines, marking zones where sellers control the market.
When support and resistance levels align across different timeframes, they become more significant and reliable for predicting price reactions.
Using the Indicator for BUY/SELL Signals
Traders can use two main strategies with this indicator: breakout and reversal trading. Both strategies should be confirmed with Price Action signals.
Breakout Trading:
BUY: When price breaks above a resistance level, enter a buy position. Place a stop loss below the nearest support level and take profit at the next resistance.
SELL: When price breaks below a support level, enter a sell position. Place a stop loss above the nearest resistance and take profit at the next support level.
Reversal Trading:
Buy Opportunity: If price fails to break support, buyers are strengthening, signaling a potential bullish reversal.
Sell Opportunity: If price fails to break resistance, sellers dominate, signaling a bearish reversal.
This approach works across all intraday, daily, weekly, and monthly charts, making it suitable for traders of all levels, from beginners to advanced.
Benefits of the Fractal Support and Resistance Indicator
Identifies multi-timeframe support and resistance for better trade accuracy
Highlights potential entry and exit points for BUY/SELL trades
Provides reliable zones for stop loss and take profit placement
Supports both breakout and reversal trading strategies
Compatible with automated trading strategies
Free to download and easy to install on MT5
Call to Action
Enhance your MT5 trading strategy with the Fractal Support and Resistance Indicator. Download it for free from IndicatorForest.com and start identifying strong support and resistance levels for profitable trades today.
FAQ
7 Downloads
Published:
Nov 21, 2025 00:59 AM
Category: