Unlocking Market Intent with the Better Volume Chart Bars Indicator
In the financial markets, price movement is the "what," but volume is the "why." While most traders look at standard volume bars at the bottom of their screen, professional traders use tools like the Better Volume Chart Bars indicator to see volume directly on their Price Action. This MT4/MT5 tool transforms raw data into a color-coded system that reveals the presence of "Big Money" and identifies high-probability reversal zones.
Understanding Better Volume Logic
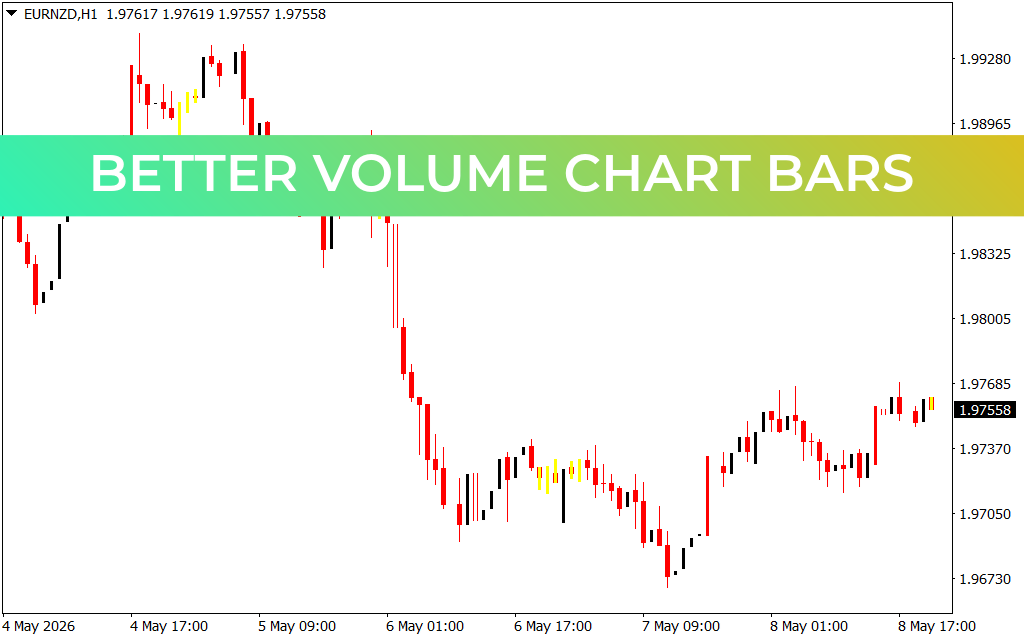
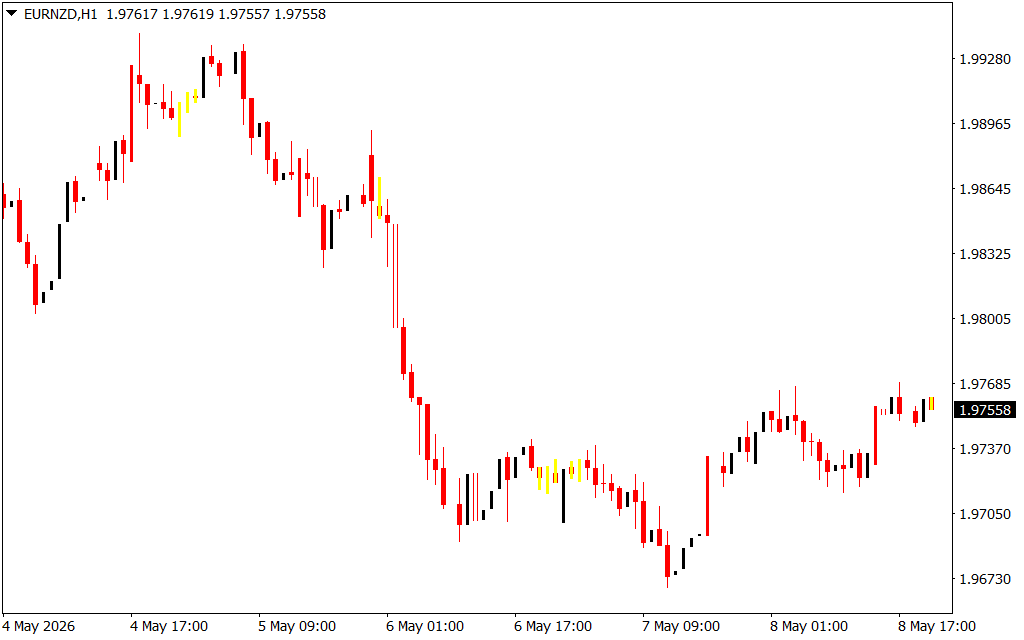
The Better Volume Chart Bars indicator is based on the principle that not all volume is created equal. It analyzes the spread (the difference between high and low) and the total volume of each candle to categorize the market's current state. Instead of just seeing red or green based on the close, you see colors that represent specific market conditions:
- Red Bars (Climax Up): These occur when there is high volume on a wide-range candle. This often signals the top of a trend where buyers are exhausted.
- White Bars (Climax Down): Similar to red bars, white candles indicate high volume on a wide-range move down, often marking a selling climax or a potential bottom.
- Yellow Bars (Low Volume): These bars indicate very low activity. They typically appear at the end of a move or during a quiet consolidation phase, suggesting that the current trend lacks conviction.
- Magenta Bars (Churn): These represent high volume on a narrow-range candle. This "churn" suggests that buyers and sellers are battling intensely, often leading to a significant breakout.
Why Use Better Volume Chart Bars?
The primary advantage of this indicator is its ability to filter out market noise. Standard volume can be misleading; however, by seeing the volume-price relationship directly on the bars, you can spot divergence. For example, if the price is making new highs but the indicator starts printing yellow bars, it is a clear warning that the move is not being supported by institutional participants.
For scalpers and day traders, these signals are invaluable for avoiding "bull traps" and "bear traps." By waiting for a "climax" signal followed by a reversal pattern, traders can enter positions with much tighter stop-losses and higher reward-to-risk ratios.
Conclusion for Modern Traders
Whether you are a price action enthusiast or a Supply And Demand trader, the Better Volume Chart Bars indicator adds a crucial dimension to your analysis. It bridges the gap between simple technical patterns and the underlying order flow of the market. By integrating this tool into your MT4 or MT5 platform, you stop guessing where the market might turn and start following the footprints of the institutions.
6 Downloads
Last Update:
May 09, 2026 00:42 AM
Published:
Jan 25, 2026 16:49 PM
Category: