Decoding Market Equilibrium: Trading Intraday Waves with the Bull Bear Balance Indicator
In liquid financial markets, consistently extracting profits requires an objective understanding of ongoing order flow. On lower timeframes like the 15-minute (M15) chart, day traders are frequently forced to navigate a confusing mix of sharp breakout extensions, deceptive liquidity traps, and complex consolidation zones. For retail traders relying solely on basic chart patterns, identifying who is truly driving Price Action—buyers or sellers—presents a major structural challenge. Without a systematic way to measure underlying volume dynamics, traders often buy right at structural trend exhaustion or short at the absolute bottom of an institutional accumulation zone.

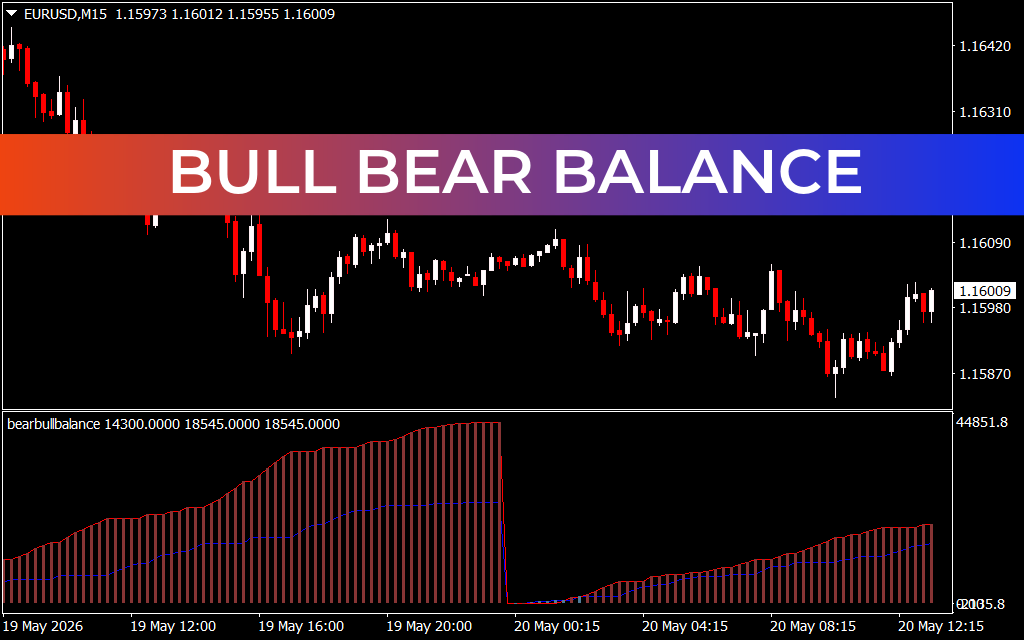
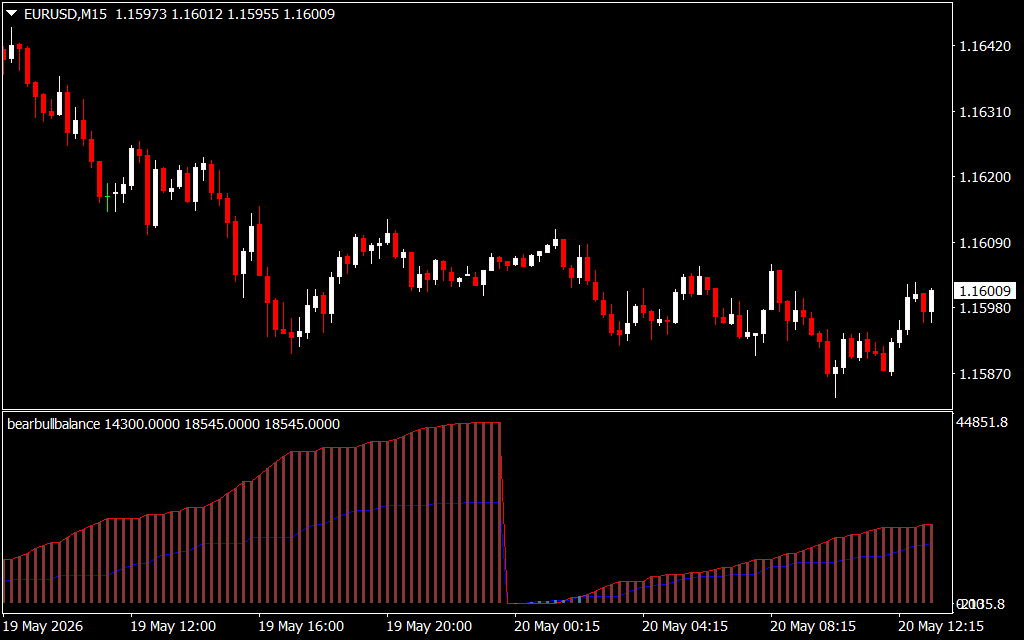
Looking closely at the EUR/USD M15 chart across the May 19th and May 20th sessions, the market showcases a beautifully clean institutional distribution and markdown cycle. The asset initially undergoes a steep, persistent decline, dropping from local distribution peaks near 1.16420 to carve out a series of lower highs and lower lows. This extended markdown phase eventually drives the exchange rate into a firm structural demand floor at 1.15870. Right after this liquidity sweep, aggressive institutional buying volume floods the market, stabilizing price and fueling a steady, multi-candle V-shaped recovery back above the 1.16009 handle.
To systematically track these macro shifts and quantify the true momentum behind price delivery, professional technical analysts move beyond basic lagging oscillators and deploy specialized volume proxies—specifically, the Bull Bear Balance indicator.
The Architecture of Two-Way Volume Tracking
Unlike traditional technical indicators that merely average historical closing values and introduce severe signal delay, the Bull Bear Balance script functions as a real-time sentiment matrix. Positioned directly beneath your candlesticks in a dedicated sub-window, the algorithm calculates the mathematical relationship between buying pressure and selling velocity over a designated lookback period, rendering it as a highly scannable histogram.
When integrated into an active M15 strategy, the system provides several distinct technical advantages:
- Visualizing Dominant Trend Bias: The indicator utilizes clean, vertical histogram bars to illustrate the net power balance in the market. During the initial, heavy downward expansion, the sub-window displays sustained historical distributions that quantify the precise strength of the sellers. This alerts day traders to look exclusively for high-probability short setups.
- Spotting Volume Resets and Accumulation Turning Points: Notice the dramatic structural shift that occurs right as the EUR/USD washes out its 1.15870 low. The histogram undergoes an instant structural reset, with the historical selling blocks completely flattening out. This clear visual shift confirms that supply has dried up and institutional buyers have actively stepped in to absorb remaining orders, signaling an ideal zone to lock in short profits or transition to long positions.
- Confirming Valid Breakout Momentum: As the market coordinates its upward recovery, the steady, systematic growth of the histogram baseline confirms that new long-side volume is actively supporting the push, protecting traders from falling for a weak counter-trend trap.
Upgrading Your MetaTrader Execution Framework
Sustaining a long-term competitive edge in the forex and CFD markets requires removing human guesswork and emotional bias from your daily workflow. Automating your trend filters with a dedicated order flow utility replaces subjective trendline mapping with pure mechanical discipline.
The Bull Bear Balance indicator is highly optimized to run efficiently in the background of your MetaTrader platform, ensuring fluid data processing without inducing terminal lag. The customizable settings panel allows you to fine-tune lookback sensitivities, adjust visual styling to complement your charting template, and establish real-time push notifications. Integrating this institutional-grade tool into your technical routine provides the structural clarity needed to align your capital with true market drivers and protect your equity base with clinical precision.
5 Downloads
Last Update:
May 20, 2026 16:30 PM
Published:
Jan 18, 2026 15:19 PM
Category: