Quantifying Market Momentum with the Candle Body Size Indicator V1
In technical analysis, the physical structure of a candlestick tells a vital story about market psychology. While standard chart patterns provide a visual representation of Price Action, they frequently lack the exact quantitative metrics required for rule-based algorithmic trading. Traders often struggle to distinguish between a weak, retail-driven price fluctuation and a high-volume, institutional breakout. The Candle Body Size Indicator V1 eliminates this ambiguity by turning visual chart structures into precise, measurable data, delivering a data-driven approach to price action analysis.
The Importance of Measuring Candle Body Metrics
A standard candlestick consists of two components: the wicks (shadows) and the body. While the wicks represent intraday price rejection and extreme volatility thresholds, the candle body represents the true net distance traveled between the opening and closing bell.
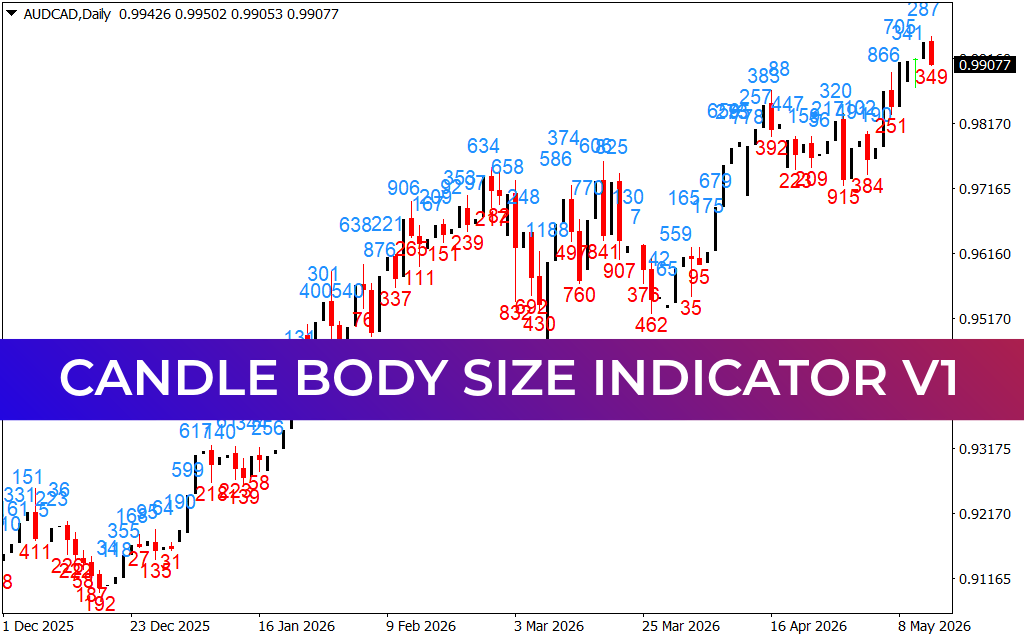
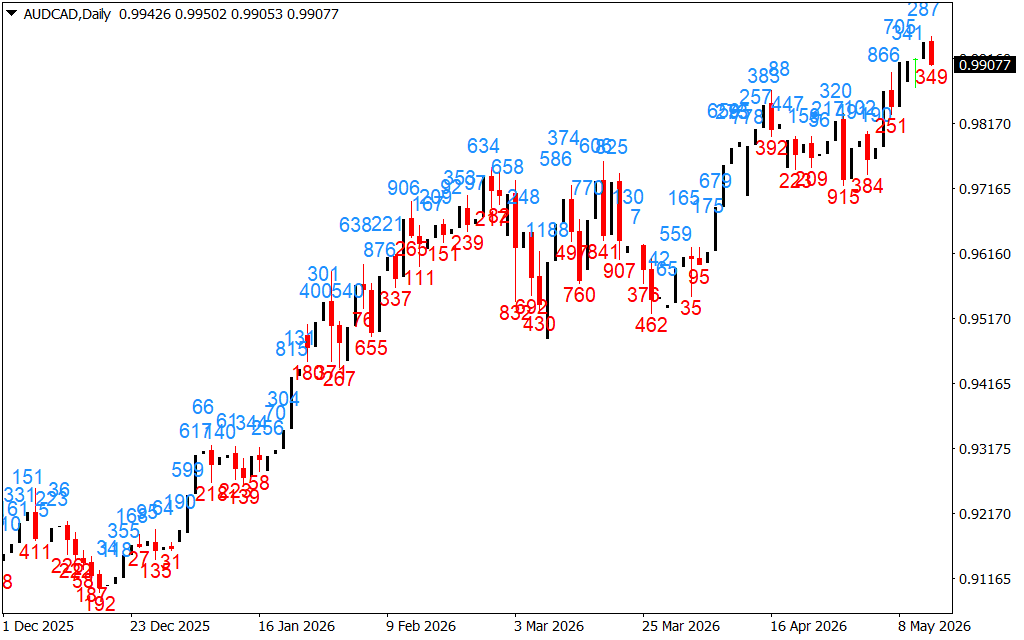
The Candle Body Size Indicator V1 automatically evaluates every historical bar on your chart, calculating the absolute mathematical distance of each candle body in points or pips. It prints these values directly onto the price panel above or below each bar:
- Blue Value Labels: Represent bullish candles where the closing price exceeded the opening price. These labels help traders instantly measure the true velocity of an ascending market wave.
- Red Value Labels: Represent bearish candles where the opening price exceeded the closing price. These labels quantify the aggressive distribution or markdown phase engineered by large institutions.
By tracking these numbers, traders can shift from guessing whether a candle looks large to knowing its exact mathematical volume footprint relative to preceding market waves.
Strategic Implementation and Execution Rules
Integrating the Candle Body Size V1 tool into your daily trading system introduces objective filters for risk management and trend execution:
- Validating Genuine Breakouts: False breakouts occur frequently in the Forex markets. When an asset attempts to break beyond a major horizontal resistance level or key moving average, check the indicator label. A breakout candle printing a body size significantly larger than the average lookback period confirms an influx of institutional capital, increasing the probability of Trend Continuation.
- Spotting Climax Reversals: In an extended trend, a sudden, exceptionally massive candle body size often marks a volume climax or exhaustion block rather than a healthy expansion. If a currency pair prints an anomalously high number after a multi-day advance, it serves as an early warning to secure profits or trail your stop-loss tightly.
- Volume Spread Analysis (VSA): Traders can use these metrics to practice systematic volume spread analysis, evaluating whether large body sizes are successfully breaking structural barriers or experiencing hidden supply overrides.
Multi-Timeframe Adaptability on the Daily Chart
While shorter intraday timeframes benefit greatly from this indicator during fast-paced Scalping sessions, the tool delivers masterclass structural clarity on macro frames like the Daily chart. As displayed on the AUD/CAD Daily layout, the indicator tracks a multi-month macro advance bar by bar, explicitly documenting the exact pips generated during high-velocity continuation days. By relying on pure math instead of visual estimates, swing traders can maintain a completely grounded, data-driven perspective on global market trends.
3 Downloads
Last Update:
May 14, 2026 21:31 PM
Published:
Jan 22, 2026 00:49 AM
Category: