The Daily Open Line Indicator for MetaTrader 5 is a simple yet effective tool for traders who want to monitor market openings and assess previous day trends. By drawing dotted lines from the first candle to the last candle of the day, this indicator provides a visual confirmation of market direction, especially on the H4 timeframe.
Unlike other indicators that generate buy or sell signals, the Daily Open Line indicator is primarily a Trend Confirmation tool. It helps traders determine the overall market sentiment from the previous day and make informed trading decisions based on that data.
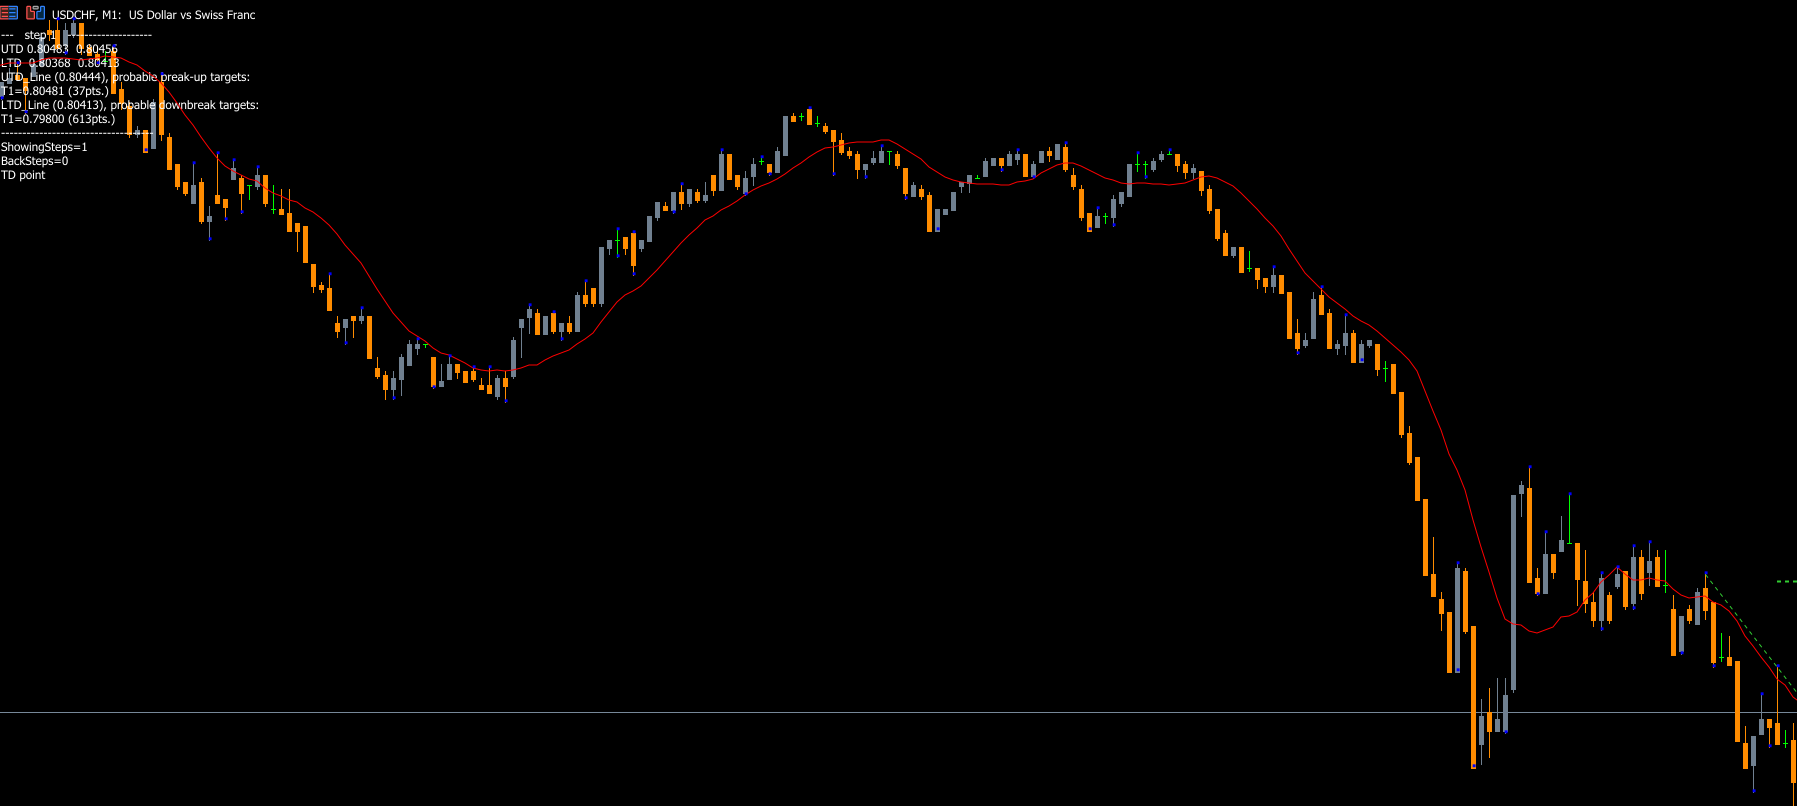
How the Daily Open Line Indicator Works
The indicator draws dotted lines on four four-hour candles, marking the open of the first candle and the close of the last candle. These lines serve as a visual reference for:
Daily market trends.
Opening and closing levels of the day.
Confirmation of signals from other indicators.
Traders are advised to use this indicator on the H4 timeframe, as it is optimized for four-hour candles. Using it on daily, weekly, or other timeframes may result in inaccurate lines and unreliable analysis.
Using the Daily Open Line Indicator for Trend Analysis
While the indicator itself does not generate buy or sell signals, it can be combined with other technical tools like RSI, MACD, or moving averages to enhance trading decisions.
Step 1: Observe Previous Day Candles
By looking at the first and last candles of the previous day, traders can gauge the market’s overall trend. If the market closed higher than it opened, the bullish trend may continue. Conversely, if it closed lower, the market may remain bearish.
Step 2: Confirm Trend with Dotted Lines
The dotted lines drawn by the indicator highlight the key opening and closing levels. These levels act as reference points for potential support or resistance zones.
Step 3: Combine with Other Indicators
For more precise entries and exits, combine the Daily Open Line indicator with momentum or trend-following indicators:
RSI for identifying overbought or oversold conditions.
MACD for trend confirmation and momentum assessment.
Moving Averages to confirm market direction.
This approach increases the reliability of trading decisions while reducing the risk of false signals.
Advantages of the Daily Open Line Indicator
Provides a clear visual of the previous day’s market trend.
Optimized for H4 charts, making it ideal for intraday traders.
Helps confirm signals from other technical indicators.
Easy to read and use, even for beginners.
Free to download and compatible with MetaTrader 5.
Conclusion
The Daily Open Line Indicator for MT5 is a useful tool for traders seeking to analyze market trends based on the previous day’s activity. By drawing dotted lines on four-hour candles, it provides essential visual cues for understanding market direction.
While it does not generate direct buy or sell signals, it can be combined with other indicators like RSI, MACD, or moving averages for more accurate trading decisions.
You can download the Daily Open Line Indicator for free from IndicatorForest.com and start confirming market trends today.
FAQ
3 Downloads
Published:
Nov 26, 2025 01:39 AM
Category: