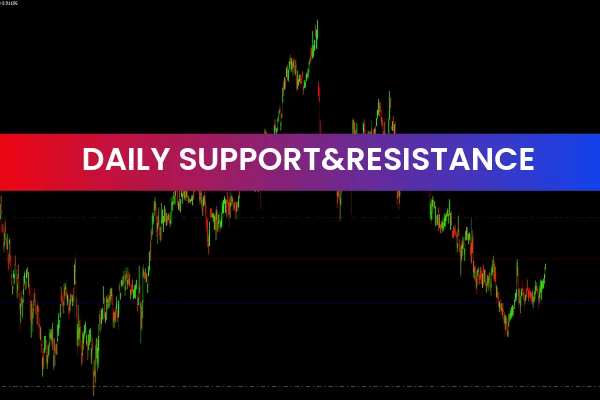
The Daily Support and Resistance Special Indicator is a powerful and popular free Forex Indicator for the MetaTrader 4 (MT4) platform. It is designed to give traders a clear and structured view of daily market conditions by automatically identifying and plotting important Support And Resistance levels on the chart.
Support and resistance levels are among the most critical concepts in technical analysis. They represent price zones where the market often reacts, reverses, or consolidates. By using the Daily Support And Resistance Indicator, traders can save time, reduce guesswork, and focus on high-probability trading decisions.
What Is the Daily Support and Resistance Indicator?
The Daily Support and Resistance Indicator is an automated price-level detection tool. It uses a sophisticated algorithm to analyze historical price data and determine the most relevant daily support and resistance zones.
Instead of manually drawing levels, traders get clearly plotted horizontal lines that highlight areas where price is most likely to react. This makes Market Structure analysis faster and more accurate.
How the Daily Support and Resistance Indicator Works
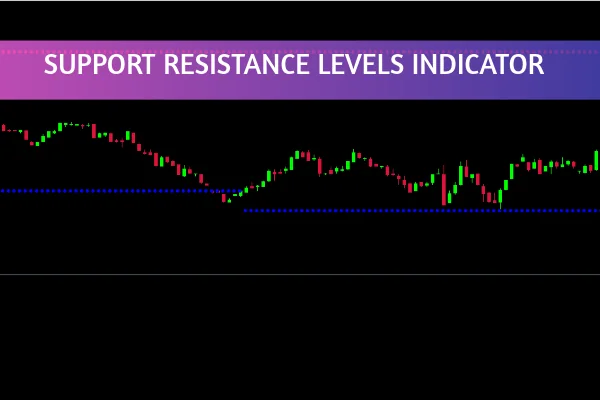
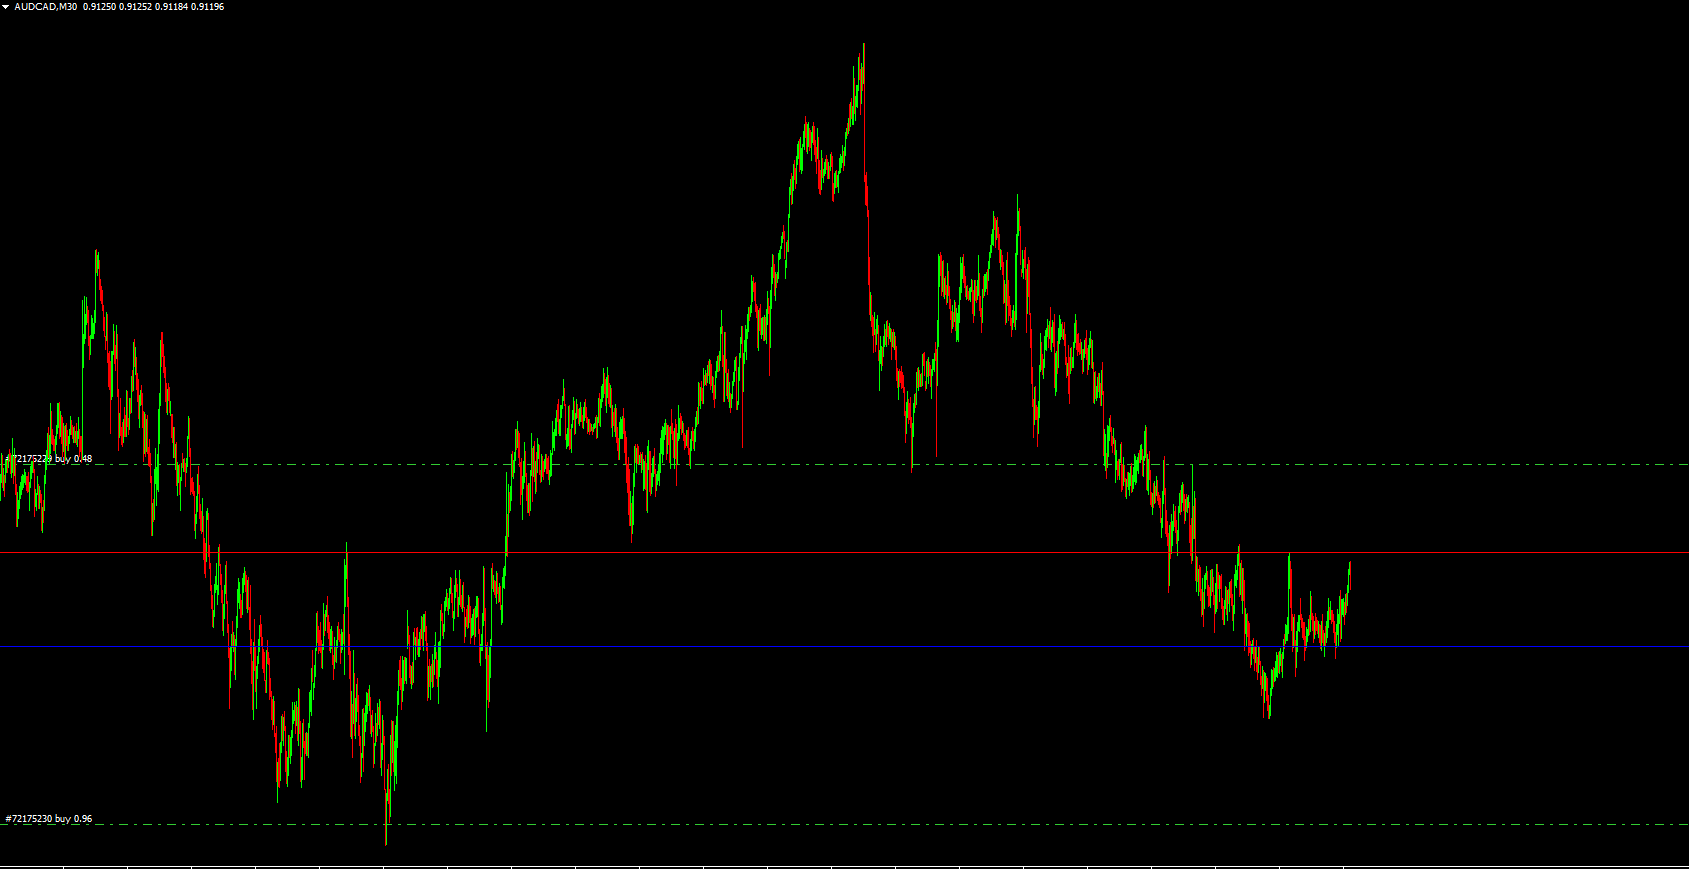
The indicator scans previous price movements and identifies key zones where price has repeatedly found support or resistance. Once detected, it plots horizontal lines directly on the chart.
Main functions include:
Automatic Detection: Identifies important daily price levels
Clear Visualization: Horizontal lines mark support and resistance
Market Structure Insight: Shows where price may stall, reverse, or break
These levels update as market conditions change, ensuring traders always have relevant information.
Key Features of the Daily Support and Resistance Indicator
Accurate Level Detection
The indicator uses advanced calculations to find the most significant daily support and resistance zones.
Clean Chart Display
Horizontal lines are clearly plotted without cluttering the chart, making analysis simple and efficient.
Saves Time and Effort
Automatic plotting eliminates the need for manual drawing and constant chart adjustments.
Free and MT4 Compatible
The Daily Support and Resistance Indicator is completely free and works seamlessly on the MT4 platform.
Benefits of Using the Daily Support and Resistance Indicator
Identify High-Probability Entry Points
Support levels can signal potential buying opportunities, while resistance levels may indicate selling zones.
Improve Exit Timing
Traders can use resistance levels to take profits on buy trades and support levels to exit sell trades.
Enhance Risk Management
Support and resistance zones help traders place stop-loss orders more strategically.
Works with Any Strategy
The indicator can be used by scalpers, day traders, swing traders, and long-term traders alike.
Using the Indicator in an Uptrend
In an uptrend, price often respects support levels and breaks above resistance. Traders may look for buying opportunities near daily support zones, especially when combined with bullish Price Action.
A strong break above resistance can signal trend continuation.
Using the Indicator in a Downtrend
In a downtrend, resistance levels often act as selling zones. Traders may look for sell opportunities near resistance, while support levels can be used as profit targets.
A break below support may confirm bearish continuation.
Best Practices for Trading with Daily Support and Resistance
Combine with Price Action
Candlestick patterns near support or resistance levels provide strong confirmation signals.
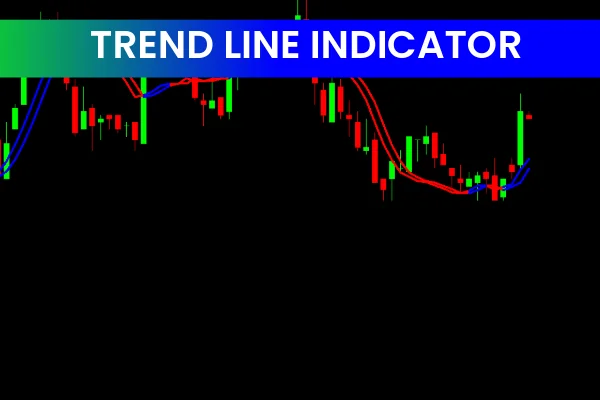
Use with Trend Indicators
Combining support and resistance with trend-following indicators improves trade accuracy.
Respect Higher-Quality Levels
Levels tested multiple times are generally stronger and more reliable.
Why Use the Daily Support and Resistance Indicator from IndicatorForest.com?
At IndicatorForest.com, traders can find reliable and professionally curated MT4 indicators that simplify technical analysis. The Daily Support and Resistance Indicator is an essential tool for traders who want a clear understanding of market structure and precise trade planning.
Call to Action:
Visit IndicatorForest.com today to download the Daily Support and Resistance Indicator and explore more powerful forex indicators to enhance your trading strategy.
FAQ
1 Download
Published:
Dec 21, 2025 01:56 AM
Category: