Precision Intraday Trading with the Fibmark Indicator
Navigating the intraday markets requires a clear understanding of where price has been and where it is likely to find support or resistance. For day traders using MetaTrader 4 (MT4), the Fibmark indicator provides an automated, mathematically sound framework based on Fibonacci retracement and extension levels. By anchoring these levels to the most recent significant Price Action, the Fibmark indicator eliminates the subjectivity of manual drawing, allowing you to focus on high-probability execution.
The Power of Automated Fibonacci Levels
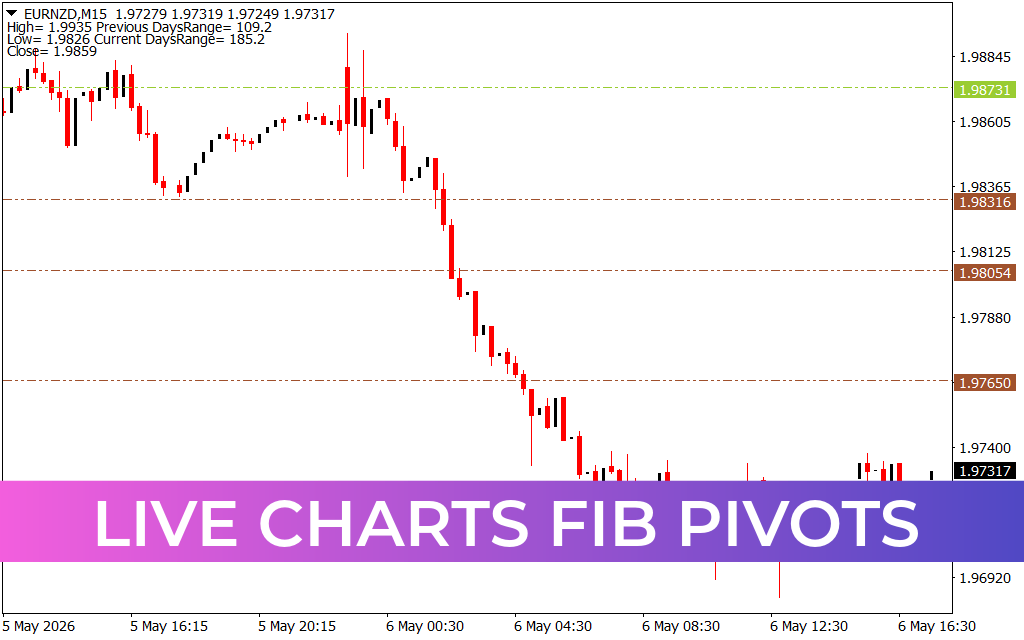
Fibonacci levels are a cornerstone of technical analysis, used by institutional traders to identify "hidden" zones of liquidity. The Fibmark indicator takes this concept and applies it dynamically to the intraday timeframe. It identifies the current session's high and low and automatically projects the critical 23.6%, 38.2%, 50.0%, and 61.8% levels directly onto your chart.
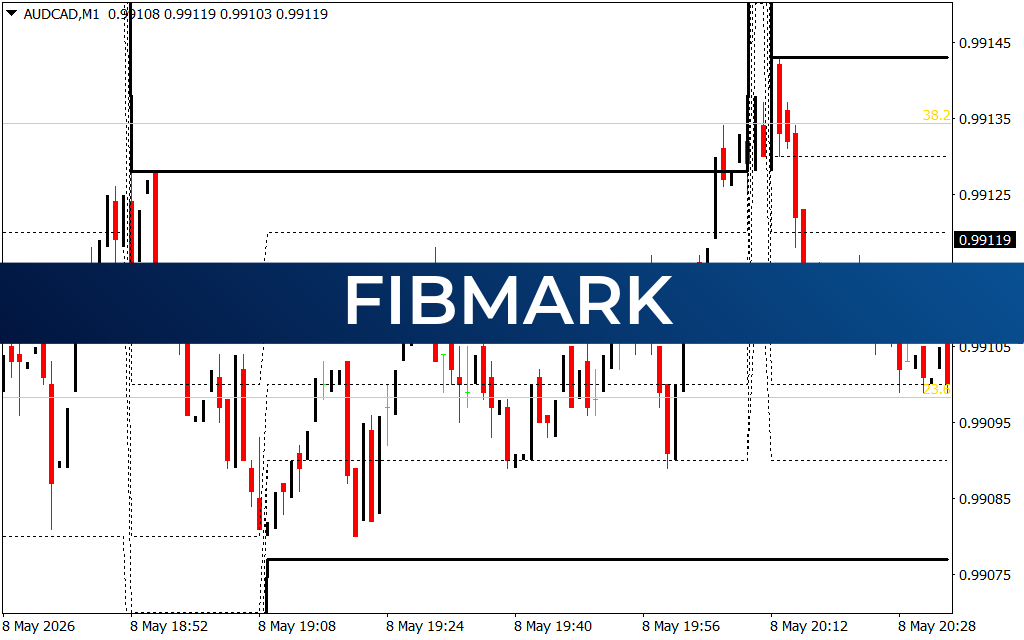
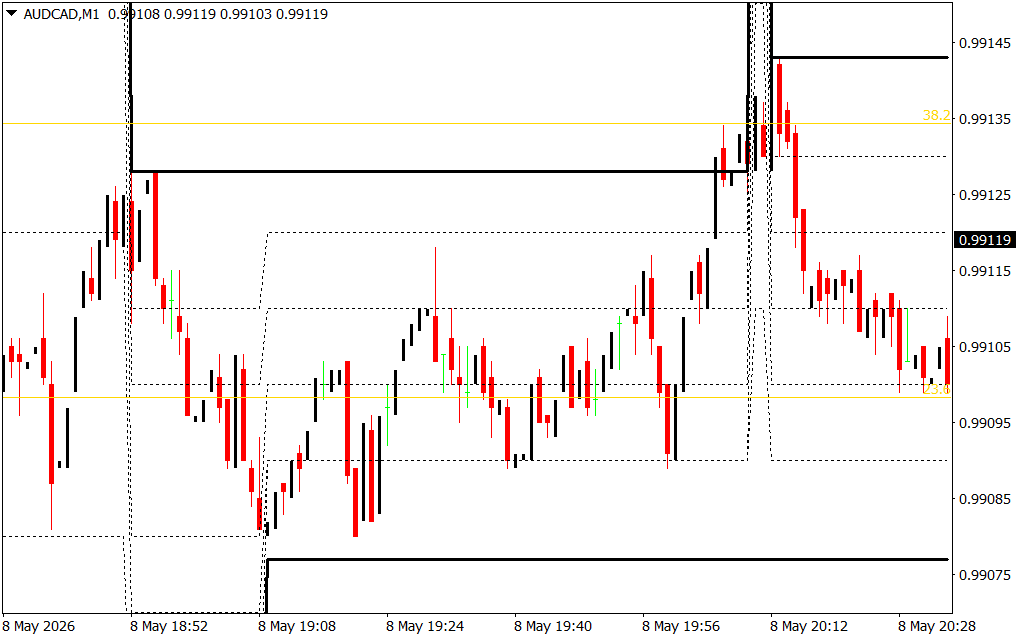
As seen on the AUD/CAD M1 chart, the indicator plots clean, horizontal markers that define the "trading range." Instead of guessing where a pullback might end, the Fibmark indicator provides a precise target—such as the 38.2% or 50.0% level—where price is statistically likely to bounce and resume its original trend.
Key Features and Strategic Advantages
- Real-Time Level Adjustment: The Fibmark indicator is dynamic. If the market makes a new intraday high or low, the Fibonacci grid adjusts instantly, ensuring your Support And Resistance levels are always based on the most current data.
- Institutional Confluence Zones: Professional "Smart Money" traders often look for confluence between Fibonacci levels and other technical markers. Fibmark provides the mathematical baseline for identifying these high-interest areas.
- Clear Visual Hierarchy: The indicator uses a clean, non-obtrusive design that identifies major and minor levels. This helps prevent "analysis paralysis" by highlighting the most important zones for price reaction.
- Optimized for Intraday Scalping: On lower timeframes like the M1 and M5, the Fibmark levels act as "geographic" markers. Scalpers can use these levels to set precise profit targets and tight stop-losses, maximizing their risk-to-reward ratio.
- Elimination of Human Bias: By automating the plotting process, Fibmark ensures that your levels are drawn with 100% mathematical accuracy every time, removing the emotional error associated with manual charting.
Strategic Implementation: The "Golden Zone" Entry
The most effective way to utilize the Fibmark indicator is the Golden Zone Retracement. Traders wait for a strong move (impulse) that establishes a new high or low. Once the impulse move is finished, price will often "correct" back into the Fibmark grid.
The area between the 38.2% and 61.8% levels is known as the "Golden Zone." When price enters this area and shows signs of rejection—such as a pin bar or an engulfing candle—it provides a high-conviction signal to enter in the direction of the primary impulse. By using Fibmark, you can objectively identify these entries with surgical precision.
Conclusion
Consistency in trading is built on a foundation of objective data. The Fibmark indicator provides that foundation by transforming the chaos of intraday price action into a structured, mathematical map. Whether you are a trend follower or a mean-reversion scalper, having automated Fibonacci levels on your MT4 platform gives you a professional edge. Elevate your technical toolkit today and start trading with the precision of the Fibonacci sequence.
2 Downloads
Last Update:
May 10, 2026 02:11 AM
Published:
Jan 24, 2026 16:14 PM
Category: