Enhance Your Market Analysis with Live Charts Fib Pivots for MT4
In the fast-moving Forex environment, professional traders rely on structural benchmarks to navigate Price Action. The Live Charts Fib Pivots indicator for MetaTrader 4 (MT4) is a premium technical tool that combines the time-tested reliability of pivot points with the mathematical precision of Fibonacci ratios. By projecting these dynamic levels onto your live charts, this indicator provides a clear roadmap for potential Support And Resistance zones.
Why Use Fibonacci Pivot Points?
Standard pivot points are excellent for identifying the market's "center of gravity," but they often miss the subtle nuances of institutional price reactions. Live Charts Fib Pivots addresses this by using Fibonacci sequences—specifically the 38.2%, 61.8%, and 100% levels—to calculate its boundaries.
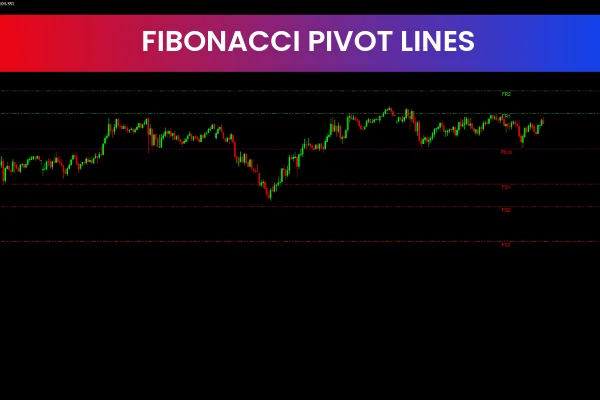
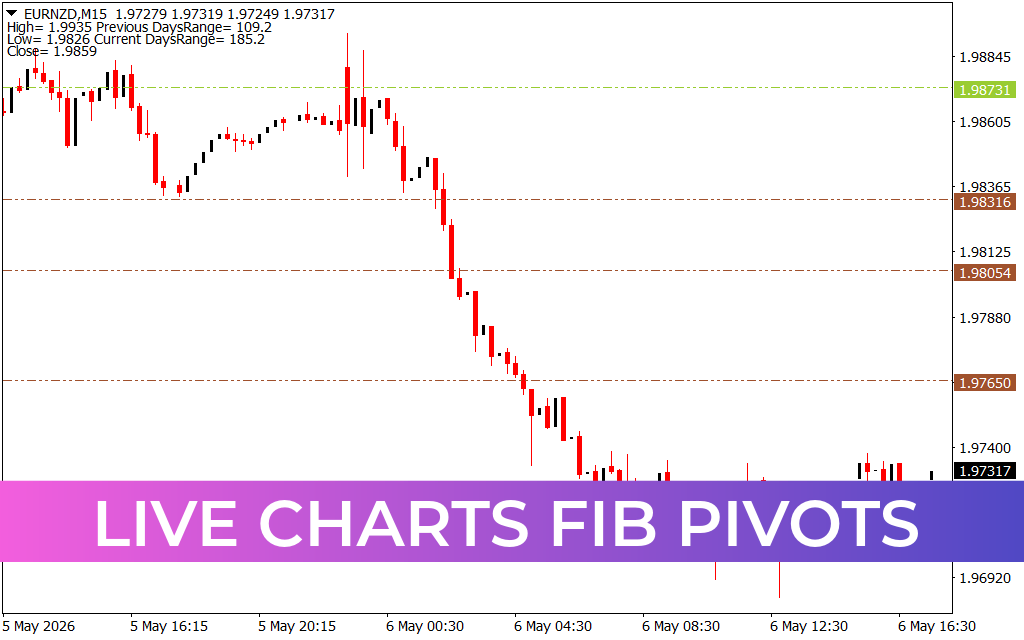
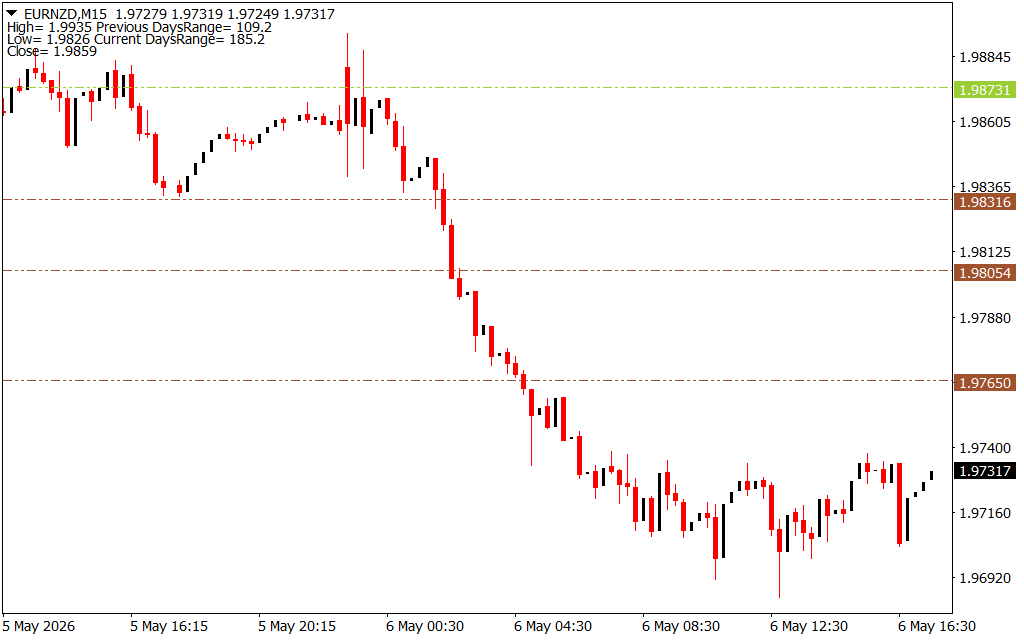
As seen in the recent market data for the EURNZD M15 timeframe, the indicator plots critical horizontal levels (brown and green dashed lines) that act as psychological magnets for price. These levels help traders anticipate where a trend might stall or where a sharp reversal could begin.
Key Features of Live Charts Fib Pivots
- Real-Time Level Updates: The indicator automatically calculates and plots levels based on the most recent daily data, ensuring you are always trading with current information.
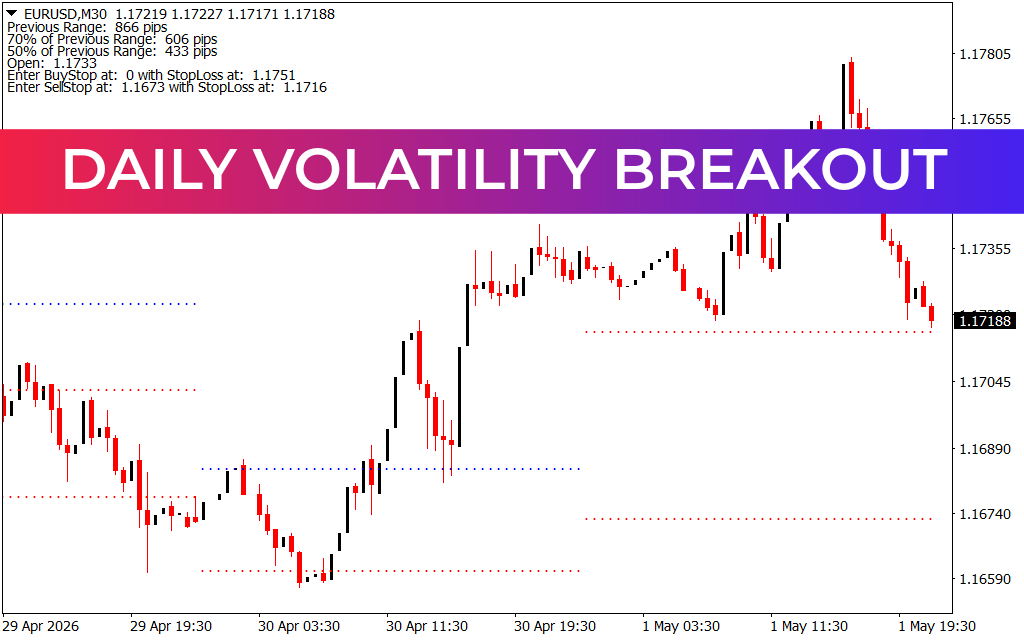
- Essential Market Metrics: As demonstrated in the top-left corner of the chart, the tool provides a quick snapshot of the previous day's high, low, and range, as well as the current day's performance.
- Visual Clarity: With distinct color-coded dashed lines, you can instantly differentiate between the main pivot (green) and the secondary Fibonacci support/resistance levels (brown).
- Adaptive Timeframe Support: While highly effective for intraday Scalping on the M15, the Live Charts Fib Pivots indicator remains robust across higher timeframes for swing trading strategies.
Effective Trading Strategies
One of the most powerful ways to utilize Live Charts Fib Pivots is to monitor the Current Day's Range. In the provided chart, the range is listed at 185.2 pips. When price approaches a Fibonacci level near the extreme end of its average daily range, the probability of a reversal is significantly higher.
Furthermore, these levels are perfect for setting precise stop-loss and take-profit orders. For instance, a trader might enter a short position as price breaks below a pivot level and target the next brown Fibonacci line as an objective. This systematic approach removes emotional guesswork and replaces it with mathematical discipline.
Conclusion
The Live Charts Fib Pivots indicator is an indispensable asset for any MT4 trader looking to refine their technical edge. It provides a sophisticated blend of market geometry and volatility analysis, allowing you to trade with the same precision as institutional participants. Whether you are managing complex currency pairs or focusing on major indices, this tool offers the structural clarity needed to thrive in today's global markets.
2 Downloads
Last Update:
May 06, 2026 20:46 PM
Published:
Jan 27, 2026 01:24 AM
Category: