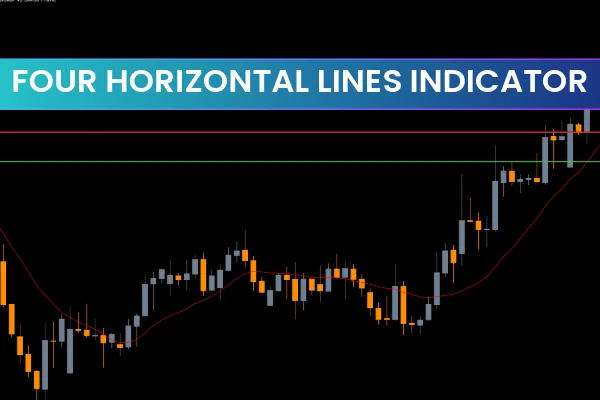
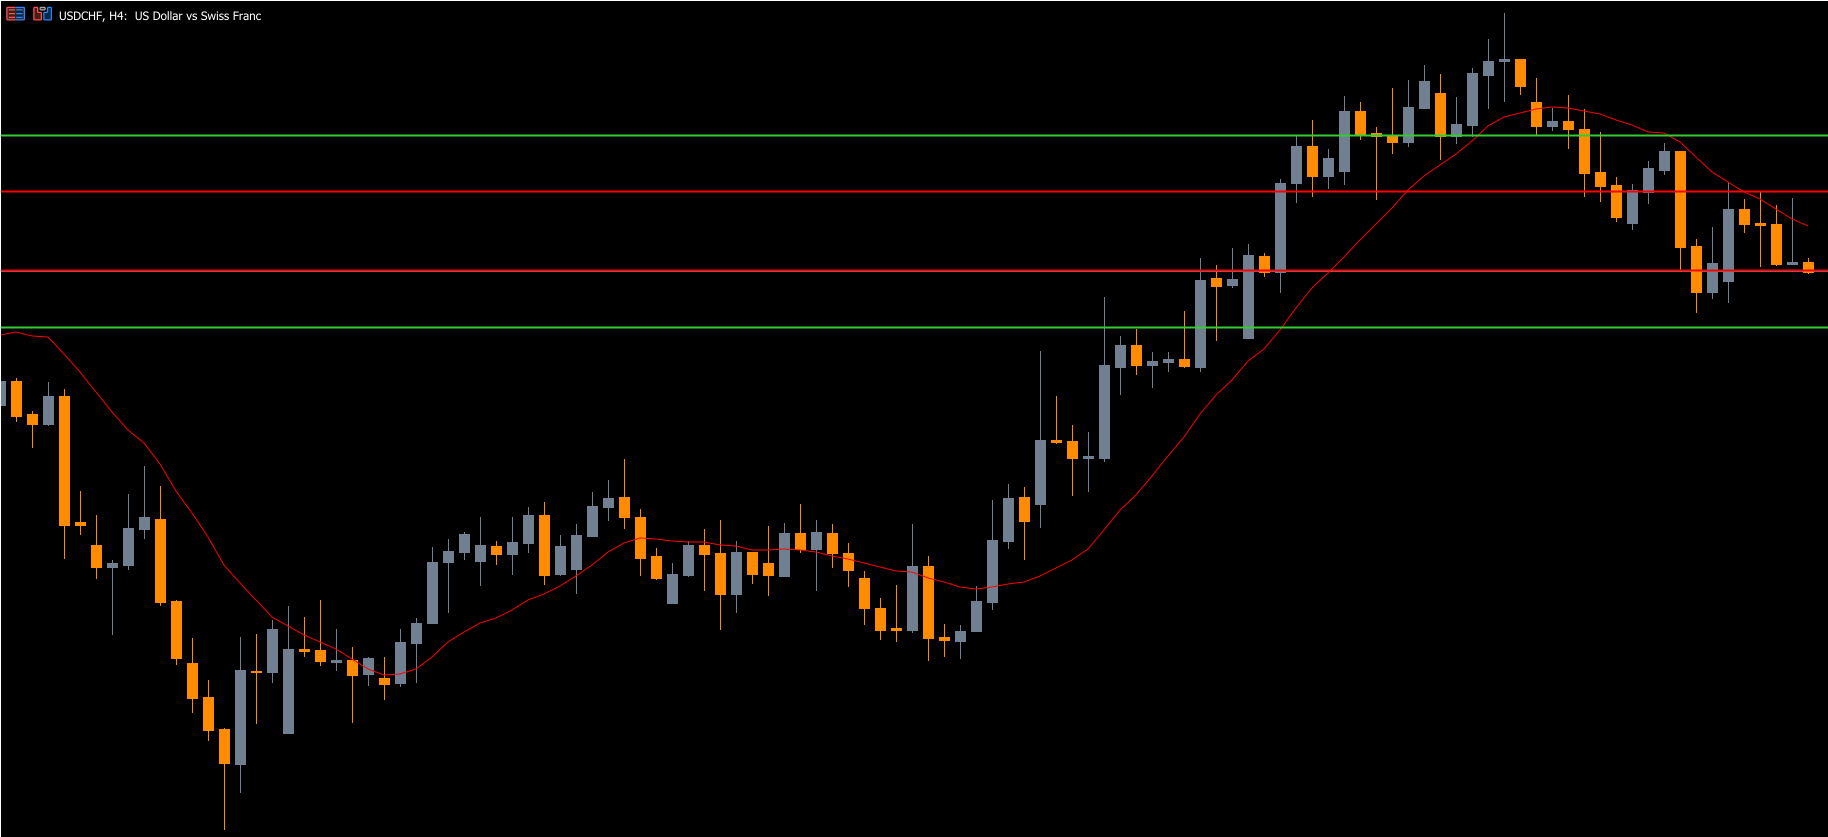
The Four Horizontal Lines Indicator for MT5 is a technical trading tool that automatically draws four horizontal lines on your chart to represent key support and resistance levels. It helps traders monitor important price zones and receive real-time alerts whenever the market approaches or crosses these levels.
Whether you are a beginner or a professional trader, this indicator is ideal for Price Action strategies, support/resistance trading, and alert-based trading setups. It eliminates the need for constant chart monitoring by notifying you when price levels are reached—saving you both time and effort.
You can download the Four Horizontal Lines Indicator for MT5 for free at IndicatorForest.com and integrate it easily into your existing trading strategy.
How the Four Horizontal Lines Indicator for MT5 Works
As the name suggests, this indicator draws four horizontal lines automatically on your chart. These lines represent critical market levels such as:
Support zones where price may bounce upward.
Resistance zones where price may face rejection or reversal.
Daily highs and lows that define market range.
Opening and closing prices that show sentiment shifts.
When the market price touches or crosses any of these horizontal lines, the indicator sends an alert directly on your MT5 platform. Some versions also allow mobile or email notifications, ensuring you never miss a trading opportunity even when away from the screen.
This makes the Four Horizontal Lines Indicator a simple yet powerful alert-based tool for manual traders and algorithmic systems alike.
How to Use the Four Horizontal Lines Indicator for MT5
To start using this tool, follow these easy steps:
Attach the indicator to your MT5 chart.
Configure parameters such as:
Line colors and styles
Alert type (sound, push, or email)
Specific price levels (optional customization)
Once configured, the indicator will automatically track price movements and notify you when price touches or crosses any of the four lines.
Ways to Use the Indicator in Trading:
Identify Support And Resistance:
The indicator automatically places horizontal lines at key support and resistance zones. When price touches these lines, traders can anticipate potential bounces or reversals.
Track Important Price Points:
You can use it to mark opening, closing, high, and low levels of the day. This helps in tracking breakout and retracement opportunities during high volatility sessions.
Receive Automated Price Alerts:
Set your preferred levels and get notifications when price hits them—perfect for traders who can’t monitor charts all day.
These functionalities make the Four Horizontal Lines Indicator extremely practical for both scalpers and swing traders who rely on technical levels for trade decisions.
Advantages of the Four Horizontal Lines Indicator MT5
Automatic Alerts: Get notified instantly when price touches any key level.
Support & Resistance Mapping: Identify potential reversal areas with precision.
Customizable Levels: Adjust line spacing, color, and alert options.
Time-Saving Tool: No need for manual chart watching.
Versatile Use: Ideal for Forex, indices, stocks, and commodity markets.
This indicator is particularly useful for price-action-based strategies, helping traders maintain discipline and focus on critical price zones without distraction.
Conclusion
The Four Horizontal Lines Indicator for MT5 is a practical and efficient market monitoring tool that automatically identifies and tracks important price levels. It keeps traders informed with instant alerts whenever price interacts with key support or resistance zones.
Whether you are looking to automate your price alert system or refine your support/resistance analysis, this indicator can significantly enhance your trading accuracy and timing.
👉 Download the Four Horizontal Lines Indicator for MT5 for free at IndicatorForest.com and start receiving smart price alerts today!
FAQ
9 Downloads
Published:
Nov 10, 2025 14:19 PM
Category: