Decoding Market Structure: A Trader’s Guide to the Fractal Level Indicator for MT5
In technical analysis, identifying key price turning points is essential for mapping out Support And Resistance zones. While many retail traders try to locate these levels manually, market noise frequently clouds judgment. For MetaTrader 5 (MT5) users seeking an algorithmic approach to market geometry, the Fractal Level indicator serves as a foundational tool. By automatically plotting critical swing highs and swing lows, this software provides an objective framework for reading institutional price delivery.
What is the Fractal Level Indicator?
Introduced to the trading world by Bill Williams, a fractal is a geometric pattern where a reversal point is identified based on a specific arrangement of five consecutive price bars. A bullish fractal occurs when a candle features two lower lows to its left and two lower lows to its right. Conversely, a bearish fractal prints when a candle is flanked by two lower highs on either side.
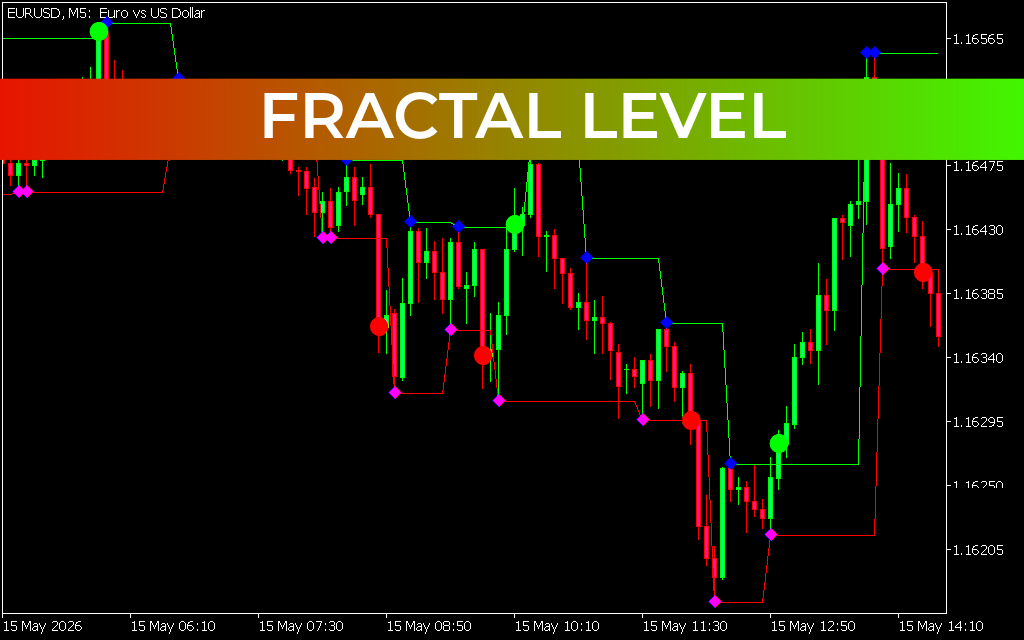
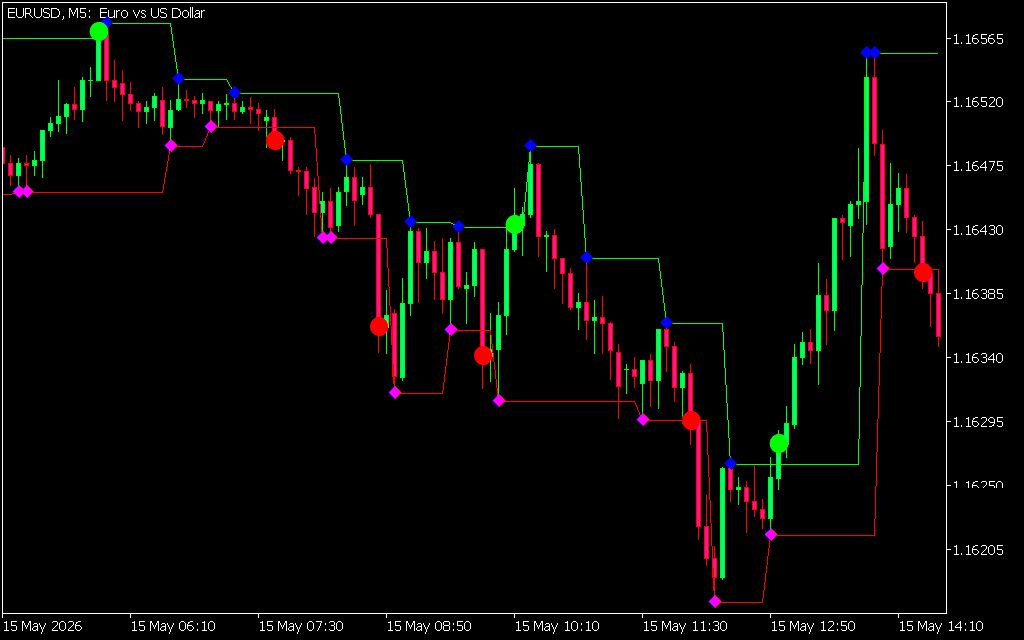
As displayed across the provided EURUSD M5 charts, this advanced MT5 version takes standard Bill Williams fractals and turns them into continuous structural lines (green for dynamic resistance ceilings and red for dynamic support floors). The indicator balances this continuous mapping with localized visual milestones:
- Large Green and Red Circles: Highlight major structural swing highs and lows where the market underwent a massive distribution or accumulation phase.
- Blue and Purple Diamonds: Mark secondary, localized micro-fractals, helping traders track immediate short-term liquidity pools.
Strategic Breakthroughs with Fractal Levels
The Fractal Level indicator for MT5 transforms raw charts into a highly structured grid, opening up several professional trading strategies:
- Liquidity Breakout Trading: Large institutions frequently rest their buy-stops above major fractal highs and sell-stops below fractal lows. When price approaches a solid green resistance line or red support line, traders look for a high-volume candle to close past the line, confirming a breakout entry to chase institutional momentum.
- Stop-Loss Placement: One of the most practical applications of this tool is establishing safe structural stop-losses. By placing a protective stop just behind a recently printed red support line or purple diamond, you ensure your risk is safely hidden behind a mathematically verified market barrier.
- Multi-Timeframe Trend Structure: In line with classic Market Structure theory, an asset in a bullish trend should continuously break green fractal ceilings while leaving red fractal floors intact. Tracking this progression on fast-moving timeframes like the 5-minute (M5) chart allows you to quickly spot when a trend is shifting.
Optimized for the Advanced MT5 Architecture
Calculating overlapping five-bar structures across multiple candle intervals can overwhelm older trading terminals. The Fractal Level indicator is fully optimized for MT5, leveraging its high-speed processing engine to scan multi-timeframe tick charts instantly. The structural lines and visual milestones update dynamically without lagging your terminal, providing rapid feedback when you need to make execution choices.
Conclusion
The Fractal Level indicator for MT5 replaces the guesswork of subjective line-drawing with pure mathematical structure. By identifying where the market has historically reversed, it gives you a clear window into where it is likely to react next. Download it today to enhance your technical setup and trade with a clearer view of market structure.
6 Downloads
Last Update:
May 16, 2026 03:10 AM
Published:
Jan 21, 2026 14:07 PM
Category: