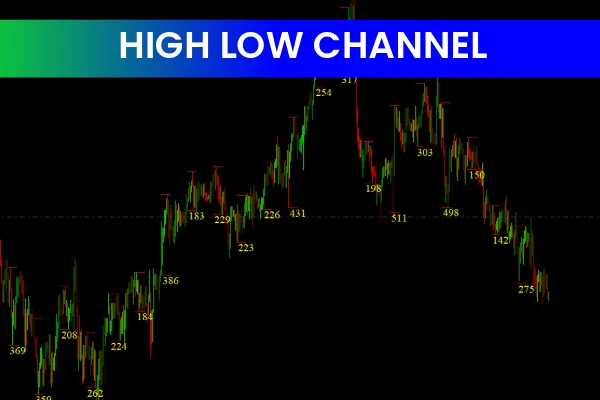
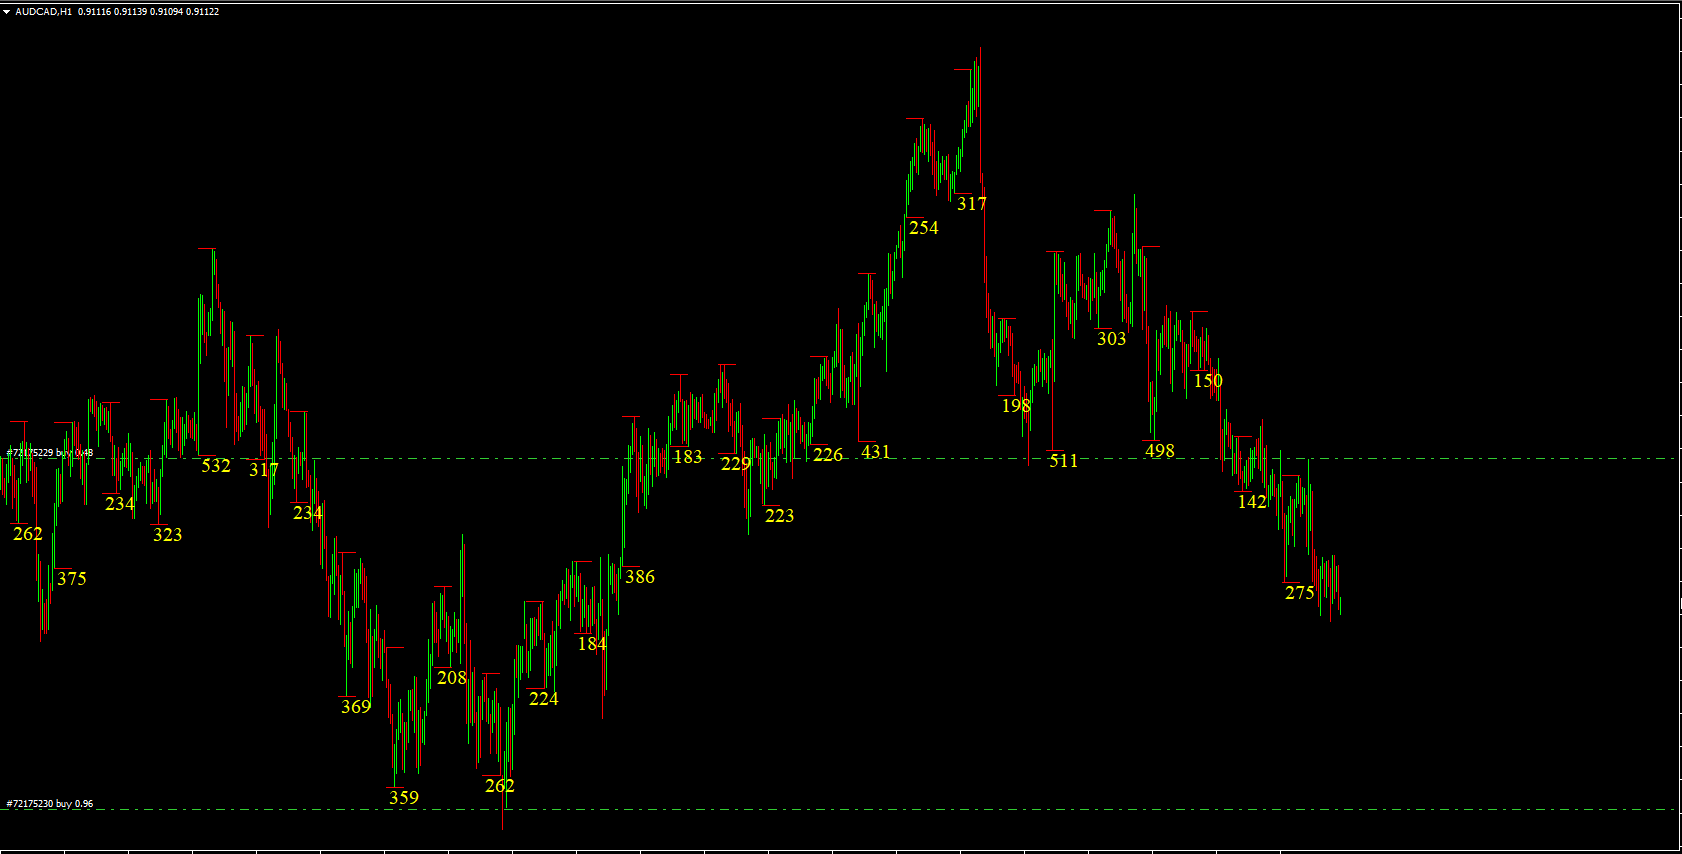
The High Low Channel Indicator for MetaTrader 4 (MT4) is a popular and free Forex Indicator designed to help traders identify market trends and key price levels with ease. By automatically plotting the highest high and lowest low over a selected period, the indicator provides a clear channel structure that highlights support, resistance, and trend direction.
This indicator is suitable for both beginner and advanced traders, offering a simple yet effective way to analyze price behavior across all timeframes.
How the High Low Channel Indicator Works
The High Low Channel Indicator analyzes historical price data over a user-defined period and calculates:
Highest High – The upper boundary of the channel
Lowest Low – The lower boundary of the channel
These two levels are then plotted on the chart as parallel lines, forming a price channel that visually represents the market’s trading range and trend structure.
Traders can adjust the calculation period to identify:
Short-term price ranges for Scalping
Medium-term trends for day trading
Long-term Market Structure for swing trading
Features of the High Low Channel Indicator
Automatic Channel Plotting
Draws the highest high and lowest low levels without manual input.
Customizable Period Settings
Allows traders to define the number of candles used in the calculation.
Clear Support and Resistance Zones
Channel boundaries act as dynamic price levels where reactions often occur.
Works on All Timeframes
Effective on M1 to Monthly charts.
Beginner-Friendly Interface
Simple visual layout with minimal chart clutter.
Benefits of Using the High Low Channel Indicator
Trend Identification
Rising channel → Bullish market
Falling channel → Bearish market
Flat channel → Ranging market
Support and Resistance Detection
The upper and lower channel lines help traders pinpoint high-probability entry and exit zones.
Breakout Trading Opportunities
Strong price movement beyond the channel may signal:
New trend formation
Improved Trade Planning
Helps with:
Stop-loss placement
Take-profit targeting
Risk-to-reward optimization
Trading Strategies Using the High Low Channel Indicator
Range Trading Strategy
Buy near the lower channel (support)
Sell near the upper channel (resistance)
Trend-Following Strategy
Trade in the direction of channel slope using pullbacks.
Breakout Strategy
Enter trades when price closes decisively above or below the channel boundaries.
Indicator Confirmation
Combine with:
RSI or MACD
Candlestick patterns
Volume or momentum indicators
Who Should Use This Indicator
The High Low Channel Indicator is ideal for:
Forex scalpers
Day traders
Swing traders
Price Action traders
Beginner traders learning market structure
Final Thoughts
The High Low Channel Indicator for MT4 is a simple yet powerful technical analysis tool that helps traders visualize trend direction and key price levels effortlessly. By defining market structure through historical highs and lows, it removes subjectivity and enhances decision-making.
Used alone or combined with other indicators, it provides valuable insights into support, resistance, breakouts, and trend strength.
FAQ
High Low Channel draws channels based on recent highs and lows, creating dynamic support and resistance levels. It helps identify price ranges and potential breakout or bounce opportunities.
Trade bounces off channel boundaries (highs as resistance, lows as support), trade breakouts when price moves beyond channels, use channel direction for trend bias, and use channel levels for stop-loss placement.
High/low channels provide clear support/resistance levels based on actual price action, help identify trading ranges, offer defined entry and exit points, and provide a simple approach to channel trading.
It works on all timeframes but is particularly effective on H1, H4, and Daily charts where high/low levels represent more significant price movements. Lower timeframes provide more frequent signals.
Combine with momentum oscillators for confirmation, use with volume indicators to validate breakouts, integrate with trend indicators, and combine with price action patterns for entry timing.
1 Download
Published:
Dec 17, 2025 00:47 AM
Category: