Decode Market Sentiment with the I One Third Candlestick Indicator
In technical analysis, the closing price of a candlestick tells the truest story of market sentiment. It reveals whether buyers or sellers won the battle within that specific timeframe. However, when trading volatile, lower timeframes like the 1-minute ($M1$) chart, parsing every single candlestick pattern manually can become overwhelming. The I One Third indicator simplifies this process by mathematically splitting each candle into three equal zones to instantly classify who is controlling the market.
By color-coding candlesticks based on where they close relative to their structural range, this tool provides intraday traders and scalpers with a clear visual edge.
The Science Behind the Three-Zone System
Standard charts show you body size and wicks, but they do not actively highlight structural exhaustion. The I One Third indicator solves this by evaluating each candle's high, low, and close, automatically applying a distinct color template based on the following structural logic:
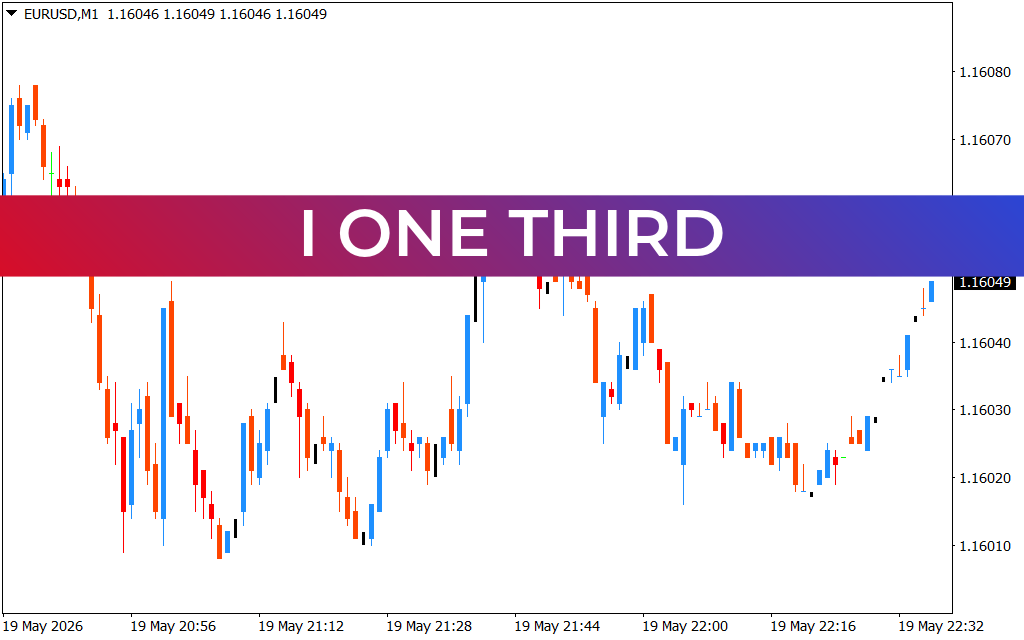
- The Upper Third (Bullish Dominance): If a candlestick closes within the top 33% of its total high-to-low range, the indicator paints it blue. This signifies intense buying pressure, showing that bulls successfully pushed price up into the close despite any intra-candle pullbacks.
- The Lower Third (Bearish Dominance): If a candle closes within the bottom 33% of its total range, it is painted orange. This indicates aggressive distribution, proving that sellers retained complete control heading into the next session open.
- The Middle Third (Market Indecision): When a candle closes within the middle 34%, it remains black or neutral. This alerts traders to a temporary equilibrium or a lack of volume momentum, warning them to avoid entering low-probability trades.
Streamlining Your Intraday Trading Strategy
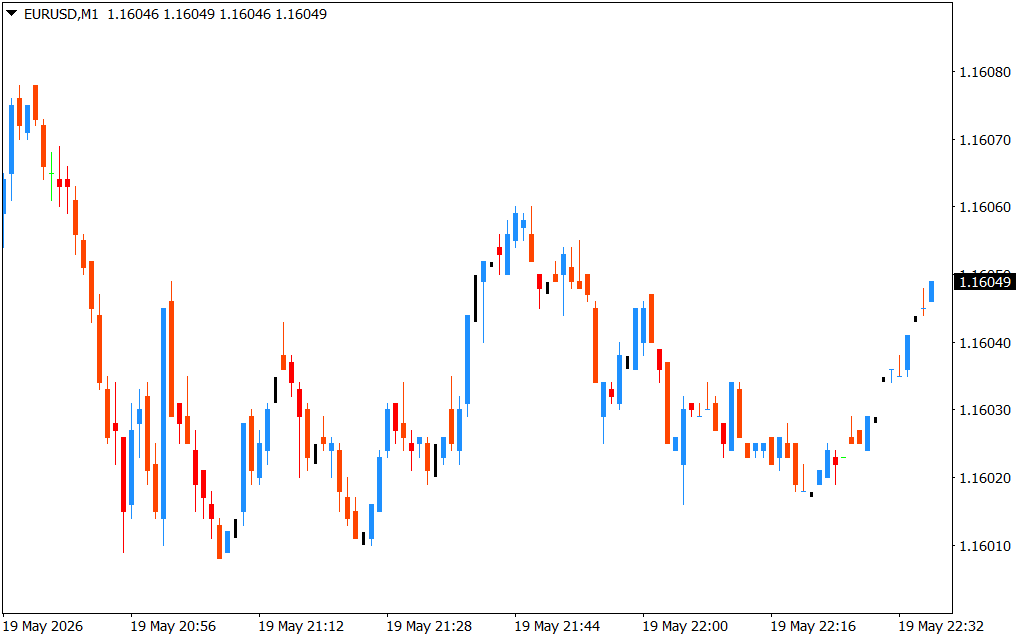
As observed on the $M1$ EUR/USD chart, trends are built on consecutive clusters of institutional sentiment. The I One Third indicator allows you to map these momentum flows effortlessly.
1. Trend Continuation Filters
During a sustained downward move, a healthy correction will print neutral black candles or isolated blue candles. However, the moment consecutive orange candles reappear, it provides instant confirmation that the dominant sellers have re-entered the market, giving you a high-probability trigger to rejoin the short trend.
2. Spotting Structural Reversals
When a steep sell-off suddenly halts and prints a series of blue candles at a known key support level, it highlights a structural shift. The immediate transition from orange dominance to blue momentum signals that aggressive buyers are absorbing the supply, marking an ideal entry window for a swift Scalping reversal.
Conclusion
The I One Third indicator strips away the complexity of traditional Price Action analysis, delivering clean, rule-based chart visuals. By instantly categorizing market sentiment on every single candle close, it prevents hesitation and helps you execute trades with mechanical clarity. Download the I One Third indicator today to transform how you read market momentum.
1 Download
Last Update:
May 20, 2026 01:38 AM
Published:
Jan 19, 2026 11:40 AM
Category: