The Igentor LSMA EMA Indicator is a popular and free Forex Indicator for the MetaTrader 4 trading platform. It is designed to help traders clearly identify trend direction and trend strength in the Forex market. By combining two powerful moving average techniques, the indicator provides a clean and effective way to analyze market conditions and make more confident trading decisions.
This indicator is especially useful for traders who prefer trend-following strategies. Instead of relying on multiple indicators, the Igentor LSMA EMA Indicator merges trend and momentum analysis into one simple visual tool, reducing chart clutter and improving clarity.
How the Igentor LSMA EMA Indicator Works signal
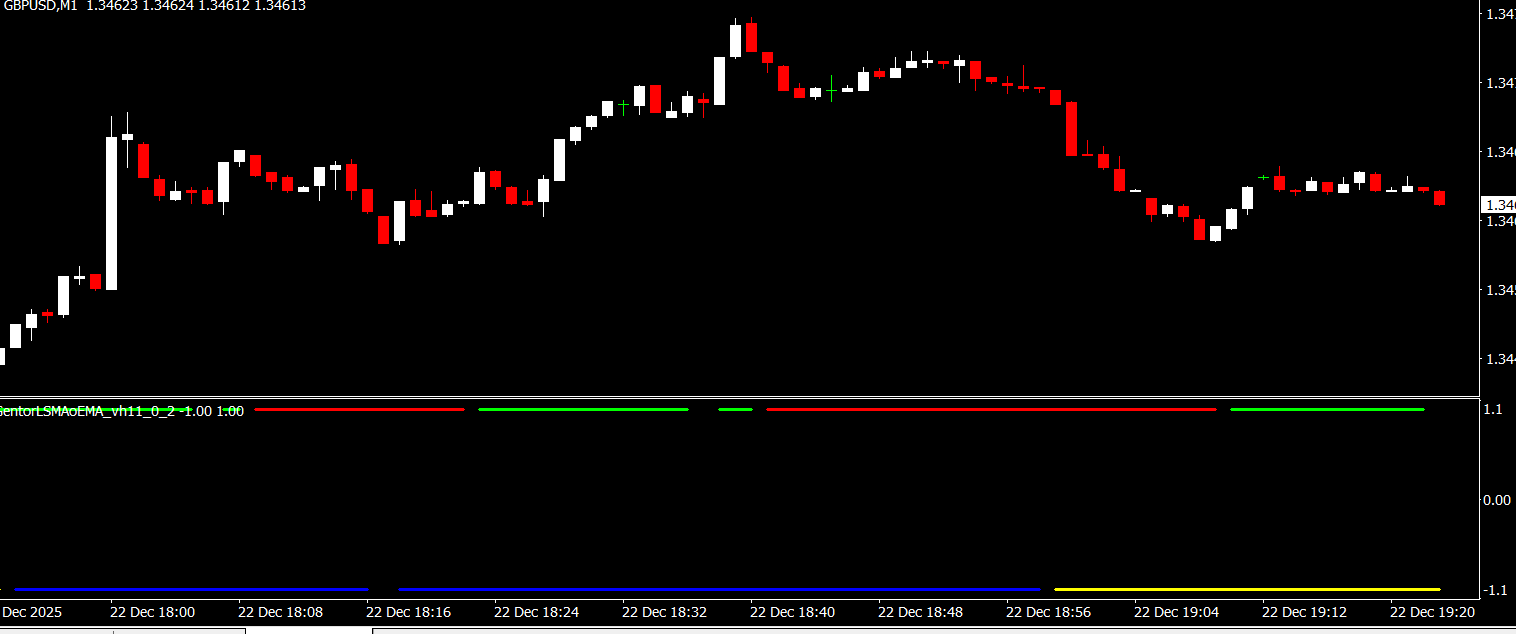
The Igentor LSMA EMA Indicator is based on two moving average lines: the Linear Regression Slope Moving Average and the Exponential Moving Average. Each line serves a specific purpose in market analysis.
The LSMA line is a trend-following component. It calculates a moving average based on linear regression of the last N price values, helping traders identify the overall market direction. Because it reacts smoothly to price changes, it is effective at filtering out market noise.
The EMA line acts as a momentum indicator. It applies more weight to recent prices, allowing it to respond faster to changes in market activity. This makes the EMA useful for measuring the strength of the current trend and detecting early shifts in momentum.
When the LSMA line crosses above the EMA line, it signals a potential uptrend. When the LSMA line crosses below the EMA line, it indicates a potential downtrend. If both lines move close together, it often suggests overbought or oversold conditions and possible consolidation in the market.
Key Benefits of the Igentor LSMA EMA Indicator
One of the main benefits of the Igentor LSMA EMA Indicator is its ability to clearly define trend direction. The crossover system provides straightforward signals that are easy to interpret, even for beginner traders.
Another advantage is its ability to reflect Trend Strength. Because the EMA reacts quickly to price changes, traders can gauge whether a trend is gaining or losing momentum. This information is valuable when deciding whether to stay in a trade or prepare for a potential reversal.
The indicator is also highly flexible. It can be used on any currency pair and across all timeframes, making it suitable for Scalping, day trading, and swing trading strategies. Traders can adjust the moving average periods to match their individual trading preferences.
How to Use the Igentor LSMA EMA Indicator Effectively
For best results, traders should use the Igentor LSMA EMA Indicator alongside other technical analysis tools. While the indicator provides strong trend signals, confirming entries with Support And Resistance levels, price action, or oscillators can improve accuracy.
Traders can also apply a multi-timeframe approach. Using higher timeframes to identify the main trend and lower timeframes to refine entry points can lead to more consistent results. Monitoring the distance between the LSMA and EMA lines can also help traders avoid entering trades during low-momentum or ranging market conditions.
Why Traders Choose the Igentor LSMA EMA Indicator
Forex traders choose the Igentor LSMA EMA Indicator because it offers a balanced combination of simplicity and effectiveness. It provides clear signals without overwhelming traders with excessive information. By blending trend direction and momentum into a single indicator, it helps traders remain disciplined and aligned with the market.
Whether used as a primary Trend Indicator or as part of a larger trading system, the Igentor LSMA EMA Indicator is a valuable addition to any MT4 trading setup.
To discover more free MT4 indicators and professional Forex trading tools, visit IndicatorForest.com and improve your trading performance today.
FAQ
2 Downloads
Published:
Dec 22, 2025 13:31 PM
Category: