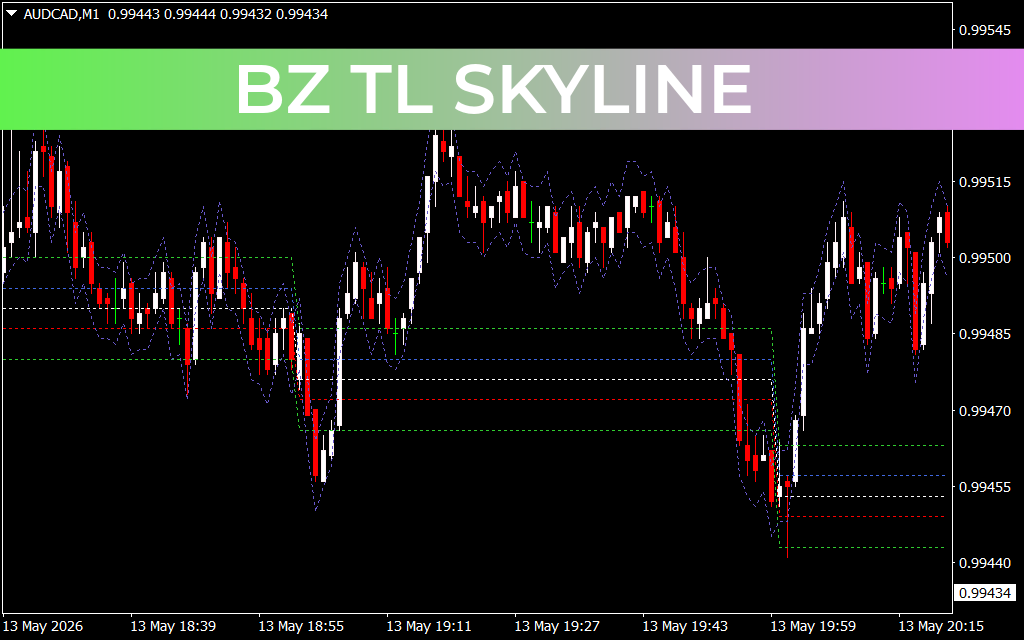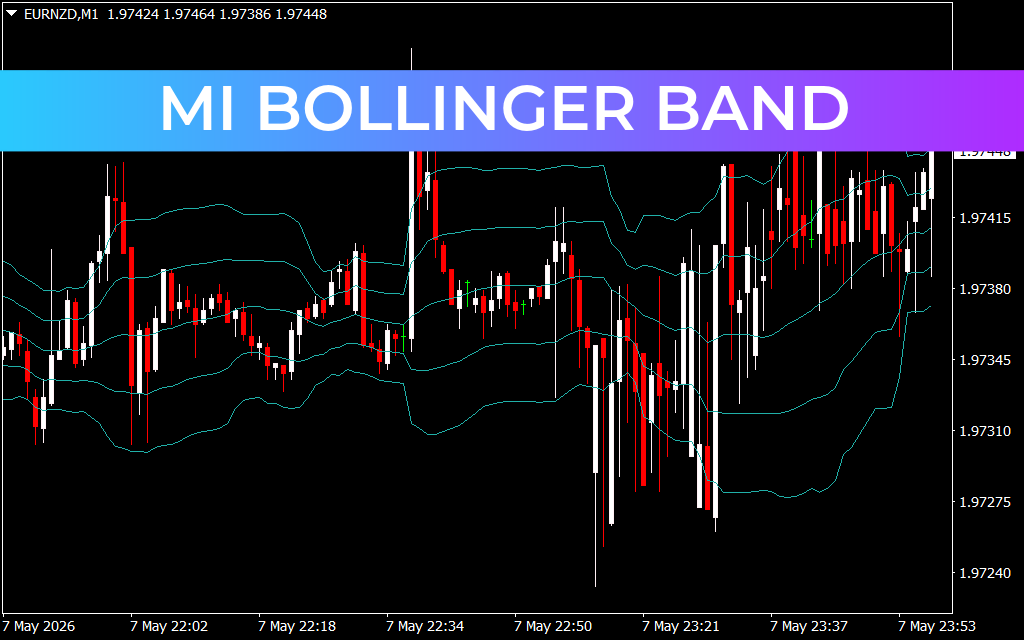
The provided chart displays the EURNZD currency pair on a 1-minute (M1) timeframe, featuring a variation of the Bollinger Bands indicator. Unlike standard bands, this setup uses multiple envelopes to create "volatility zones," which help traders identify overextended Price Action and potential mean reversion points.
Mastering Volatility with the MI Bollinger Band Indicator
In the fast-paced world of Forex trading, timing is everything. The MI Bollinger Band indicator is a sophisticated technical analysis tool designed to help traders navigate market noise and identify high-probability entry and exit points. By evolving the classic Bollinger Band formula, this indicator provides a multi-layered view of price volatility and Trend Strength.
What is the MI Bollinger Band?
Standard Bollinger Bands consist of a central moving average and two standard deviation lines. The MI (Multi-Indicator) version takes this a step further by plotting multiple sets of bands. This creates a "ribbon" effect, mapping out different tiers of market sentiment. When price action pierces the outer layers, it signals an extreme condition—either a powerful trend breakout or an exhausted market ready for a reversal.
Key Features and Trading Benefits
- Dynamic Volatility Mapping: The bands automatically expand during high volatility and contract during consolidation (the "squeeze"). This allows traders to anticipate explosive moves before they happen.
- Overbought and Oversold Zones: By using multiple deviations, the MI Bollinger Band provides clearer "exhaustion zones" than traditional single-line envelopes.
- Trend Confirmation: When price stays "walking the bands" (hugging the upper or lower outer lines), it confirms a strong momentum phase, preventing traders from betting against a healthy trend too early.
- Precision Scalping: On lower timeframes like the M1 or M5, the indicator is invaluable for scalpers looking to capture quick pips as price bounces between the inner and outer bands.
How to Trade with MI Bollinger Bands
The most effective way to use this tool is to look for rejection wicks at the outermost bands. If a candle closes outside the primary envelope and is followed by a reversal candle, it often indicates a return to the mean (the center line). Conversely, a "squeeze"—where all bands tighten significantly—is a precursor to a major breakout. Smart traders wait for a candle to close outside the squeeze to jump on the emerging trend.
Whether you are a day trader or a scalper, the MI Bollinger Band indicator adds a layer of mathematical certainty to your charts, helping you trade with the trend and exit before the tide turns.
2 Downloads
Last Update:
May 08, 2026 02:59 AM
Published:
Jan 25, 2026 22:29 PM
Category: