Mastering the Trend: The Definitive Guide to Moving Averages in Trading
In the world of technical analysis, few tools are as foundational or as widely respected as the Moving Average (MA). Used by everyone from retail day traders to institutional hedge fund managers, moving averages serve as the primary lens through which market trends are identified and measured. By smoothing out price fluctuations over a specific period, they provide a clear view of market direction that raw candlestick data often obscures.
What is a Moving Average?
At its core, a moving average is a lagging indicator based on past price data. It calculates the average price of a security over a set number of periods—such as 20, 50, or 200 days—and plots that data as a single, fluid line on the chart. As new price data becomes available, the oldest data point is dropped, causing the "average" to move forward in time.
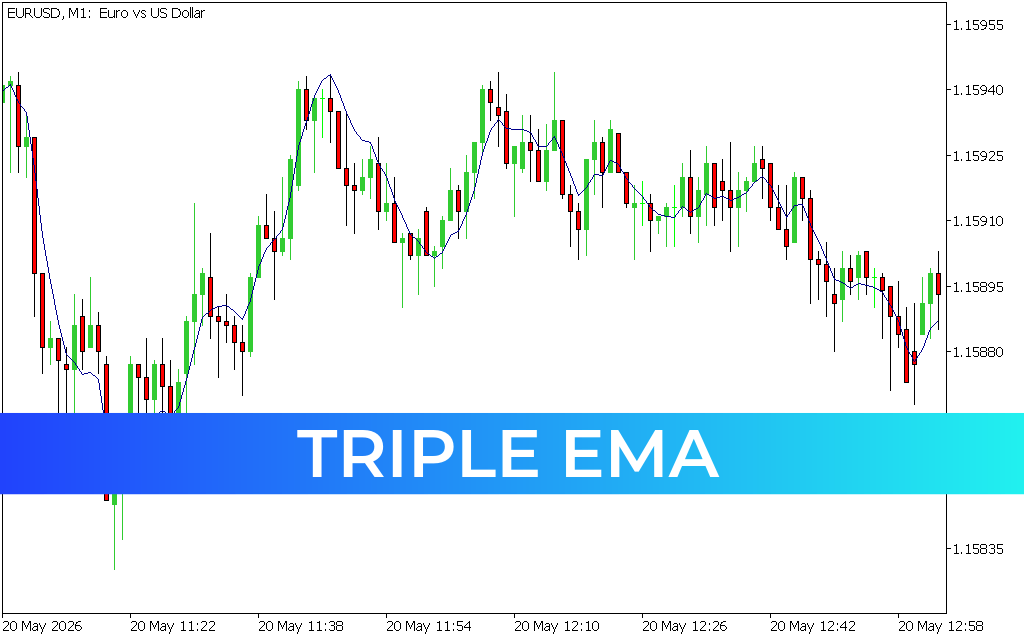
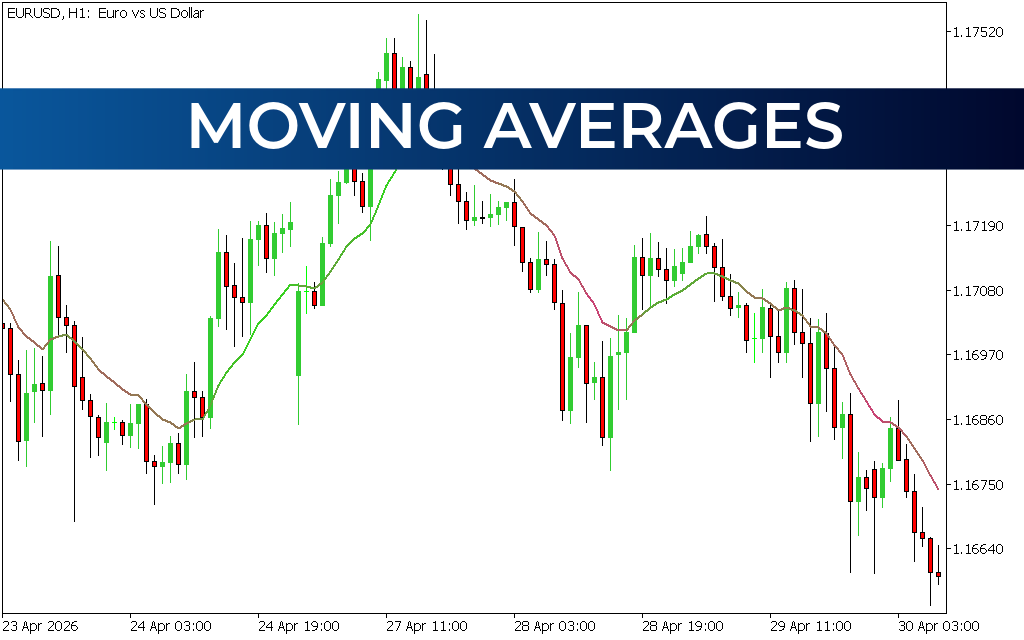
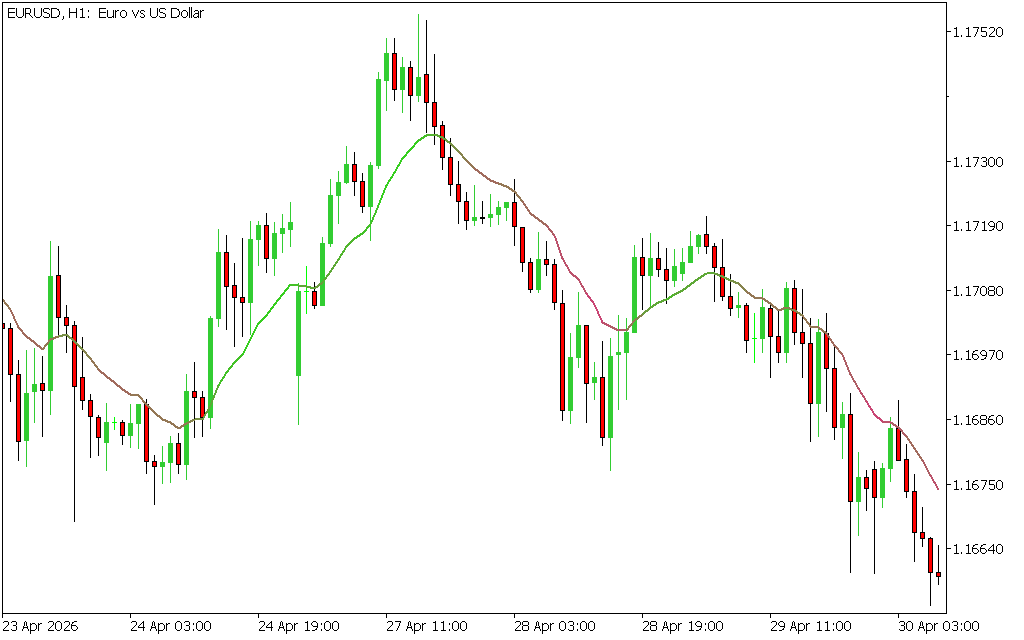
As shown in the EURUSD H1 chart, the moving average line changes color (shifting from green to brown) to reflect changes in momentum. This visual representation allows traders to instantly gauge whether the bulls or bears are in control without getting distracted by minor market noise.
Common Types of Moving Averages
While there are many variations, two versions dominate the trading landscape:
- Simple Moving Average (SMA): This calculates the arithmetic mean of a set of prices over a specific period. It is highly effective for identifying long-term Support And Resistance levels.
- Exponential Moving Average (EMA): Unlike the SMA, the EMA places a greater weight on the most recent prices. This makes it more responsive to new information, which is particularly useful for short-term Scalping and trend-following strategies.
Strategic Implementation in the Markets
The true power of moving averages lies in their versatility. They are commonly used in three distinct ways:
- Trend Identification: The most basic rule is that when the price is above a moving average, the trend is up. When the price is below, the trend is down.
- Support and Resistance: In a strong trend, the moving average line often acts as a "dynamic" floor or ceiling. Traders look for price to bounce off these lines to find high-probability entry points.
- The Moving Average Crossover: By using two averages of different lengths (e.g., a 50-period and a 200-period), traders look for "crosses." When the short-term average crosses above the long-term average (a Golden Cross), it signals a major bullish shift. The opposite (a Death Cross) signals a bearish breakdown.
Conclusion
Moving averages are the heartbeat of trend-following systems. By filtering out the daily "noise" of the financial markets, they provide a structured way to view Price Action. Whether you are using them as a standalone signal or as a filter for complex indicators, mastering the moving average is a mandatory step for anyone looking to achieve consistent success in trading.
6 Downloads
Last Update:
May 08, 2026 01:06 AM
Published:
Jan 26, 2026 18:04 PM
Category: