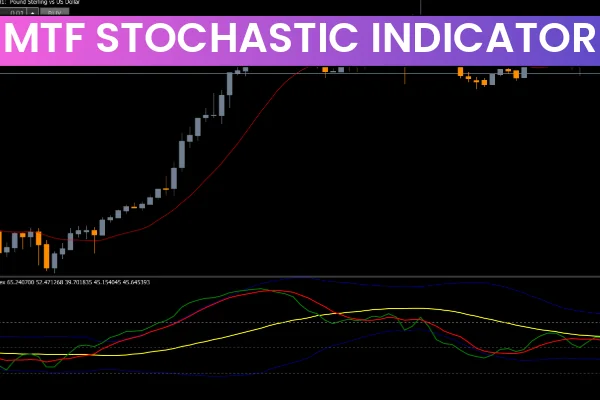
The MTF Stochastic Indicator for MT5 is a versatile technical tool designed to help traders identify overbought and oversold market conditions. Built on the foundation of the traditional stochastic oscillator, it plots two moving average lines—K and D—fluctuating between 0 and 100. This simplicity allows traders to spot potential trend reversals and make informed entry or exit decisions across multiple timeframes.
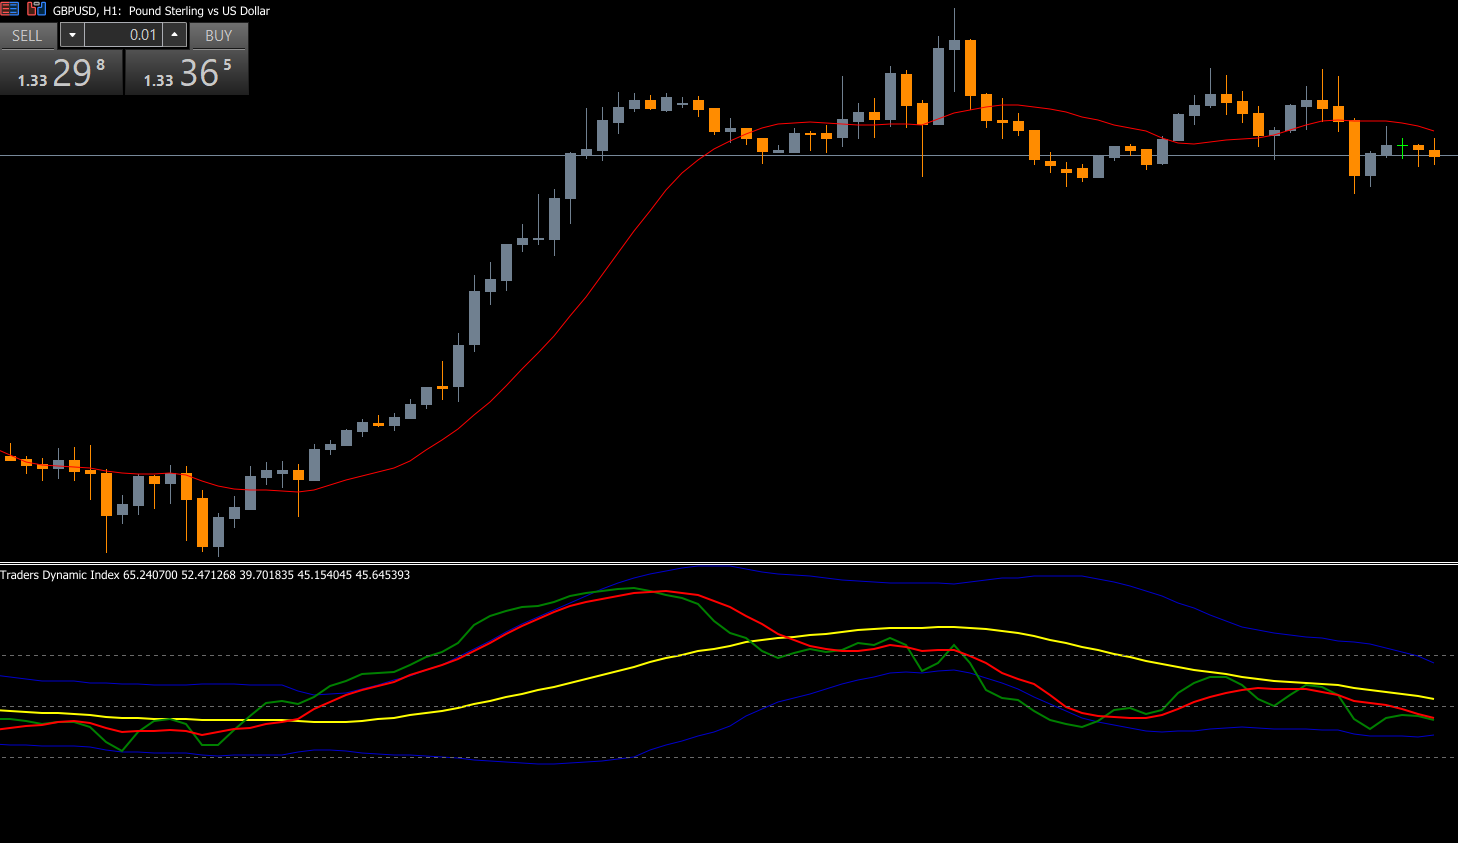
One of the key advantages of the MTF Stochastic Indicator is its multi-timeframe functionality. Traders can use it on short-term charts like M1 or M5 for Scalping, or on longer-term charts like H1, H4, and Daily for swing trading. This flexibility makes it suitable for both novice and advanced traders seeking a reliable tool to gauge market momentum.
How the MTF Stochastic Indicator Works
The MTF Stochastic Indicator measures the momentum of price movements and identifies potential reversal zones.
Overbought Zone: When the K and D lines approach the 80 level, it signals that the market may be overbought and a short trade could be considered.
Oversold Zone: When the K and D lines approach the 20 level, it indicates an oversold market, signaling a potential long trade.
The indicator calculates these levels using moving averages of the price, giving traders a smoothed and accurate view of market momentum.
How to Trade With the MTF Stochastic Indicator
Trading with the MTF Stochastic Indicator is straightforward, thanks to its clear overbought and oversold zones.
Entering Trades
Buy Signal: When the K and D lines are near the 20 level (oversold zone), traders can open a long position, anticipating a price reversal to the upside.
Sell Signal: When the K and D lines are near the 80 level (overbought zone), traders may open a short position, expecting the market to reverse downward.
Signal Confirmation
For higher accuracy, the MTF Stochastic Indicator can be combined with other technical tools, including:
Moving Averages (MA): Confirms trend direction and filter false signals.
Support And Resistance Levels: Enhances entry and exit precision.
RSI (Relative Strength Index): Validates overbought and oversold conditions.
This multi-indicator approach ensures that trades align with overall market momentum and reduces the likelihood of entering during false signals.
Benefits of Using the MTF Stochastic Indicator
Clear Overbought/Oversold Signals: Helps traders identify potential reversal zones efficiently.
Multi-Timeframe Compatibility: Works on all timeframes for scalping, intraday, and swing trading strategies.
Simple to Read: Easy-to-interpret lines (K and D) allow for quick decision-making.
Enhanced Trading Accuracy: Combining with other indicators improves signal reliability.
Free to Download: Available for immediate download on IndicatorForest.com.
Conclusion
The MTF Stochastic Indicator for MT5 is a powerful yet easy-to-use tool for identifying overbought and oversold market conditions. Its ability to work across multiple timeframes makes it ideal for traders of all levels, from beginners to experienced professionals. By combining it with other technical indicators like Moving Averages or RSI, traders can confirm signals and improve their overall trading accuracy.
Download the MTF Stochastic Indicator for free from IndicatorForest.com and start spotting high-probability trade setups today. Incorporate it into your trading toolkit to enhance trend analysis, capture reversals, and maximize profits.
FAQ
21 Downloads
Published:
Dec 07, 2025 02:09 AM
Category: