The Nice Value Chart Indicator is a popular and free Forex tool for the MetaTrader 4 (MT4) platform. It is designed to help traders identify the best entry and exit points by analyzing the current market trend and market value. Its simplicity and accuracy make it a favorite among both beginners and experienced traders.
This indicator uses a combination of lines, bars, and colored dots to visually represent market conditions, making trend analysis and trade timing easier and more precise.
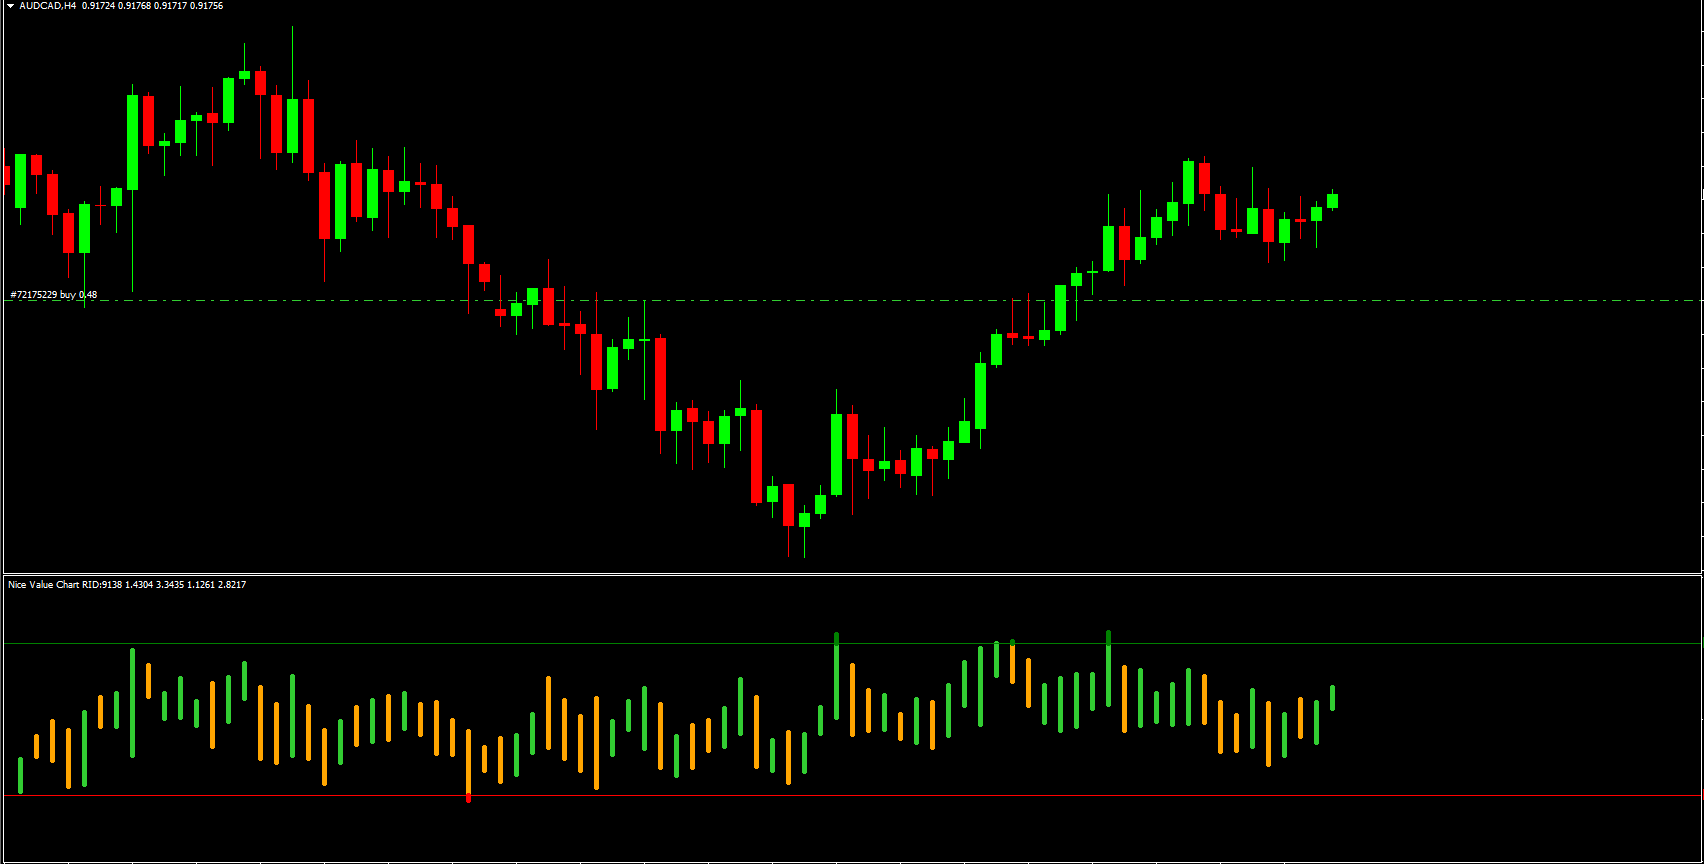
How the Nice Value Chart Indicator Works
The Nice Value Chart Indicator uses a combination of visual tools to help traders understand market trends:
Lines: Represent the current market value, helping traders gauge price levels
Bars: Show the current trend direction and momentum
Colored dots: Indicate whether the market is moving upwards or downwards
By analyzing these components together, traders can quickly determine the prevailing trend and make informed trading decisions.
Why Forex Traders Use the Nice Value Chart Indicator
Traders rely on the Nice Value Chart Indicator because it provides a clear picture of market direction and timing:
Identifies the current market trend accurately
Highlights optimal entry and exit points
Easy to read with clear visual cues
Suitable for all market types, including Forex
Its user-friendly design and accuracy make it particularly useful for traders who want to simplify trend analysis and improve trade timing.
Trading Strategies Using the Nice Value Chart Indicator
Trend Following Strategy
Traders can use the indicator to follow the prevailing market trend. Entering trades in the direction indicated by the bars and colored dots allows traders to capitalize on trend momentum.
Entry and Exit Timing
The lines representing market value help traders determine optimal entry and exit points. For example, a buy trade can be entered when the market value line aligns with bullish trend bars and dots, and exited when signals reverse.
Market Direction Confirmation
The indicator can also serve as a confirmation tool alongside other technical indicators like moving averages, oscillators, or Support And Resistance levels. This reduces false signals and increases trading accuracy.
Best Timeframes for the Nice Value Chart Indicator
The Nice Value Chart Indicator is versatile and can be applied across multiple timeframes:
Lower timeframes: 1-minute, 5-minute for Scalping
Medium timeframes: 15-minute, 30-minute for intraday trading
Higher timeframes: 1-hour, 4-hour for swing trading
Higher timeframes tend to provide more reliable trend signals, while lower timeframes give more frequent trading opportunities.
Combining the Nice Value Chart Indicator with Other Tools
For better trading results, traders often use the Nice Value Chart Indicator in combination with:
Moving averages for trend confirmation
Support and resistance levels for entry and exit timing
Momentum oscillators like RSI or MACD
You can explore more MT4 indicators and professional trading tools on IndicatorForest.com, where traders can build effective Forex strategies.
Final Thoughts on the Nice Value Chart Indicator
The Nice Value Chart Indicator is a simple yet powerful Forex tool for identifying market trends and optimal trade entries and exits. Its combination of lines, bars, and colored dots provides a clear visualization of market conditions, helping traders make informed decisions with confidence.
Whether you are a scalper, intraday trader, or swing trader, this indicator is a valuable addition to any MT4 trading setup.
👉 Visit IndicatorForest.com to explore more free MT4 indicators, professional trading tools, and Forex strategy resources.
1 Download
Published:
Dec 27, 2025 13:15 PM
Category: