In the dynamic world of Forex trading, understanding market cycles is essential for consistent success. The Quarters Theory Indicator is a free and powerful tool for MT4 traders that offers a unique perspective on the market’s cyclical movements. By highlighting distinct market phases, this indicator allows traders to anticipate Price Action and make more informed trading decisions.
How the Quarters Theory Indicator Works
The Quarters Theory Indicator is based on the concept that the market moves in four distinct quarters or cycles, each with its own characteristics:
Quarter 1: Early phase, often characterized by low volatility
Quarter 2: Trending phase, where the market begins to gain momentum
Quarter 3: Peak phase, often associated with potential reversals
Quarter 4: Declining phase, where the market consolidates or reverses
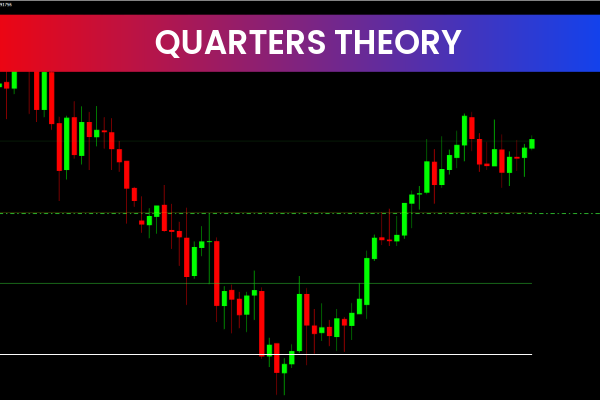
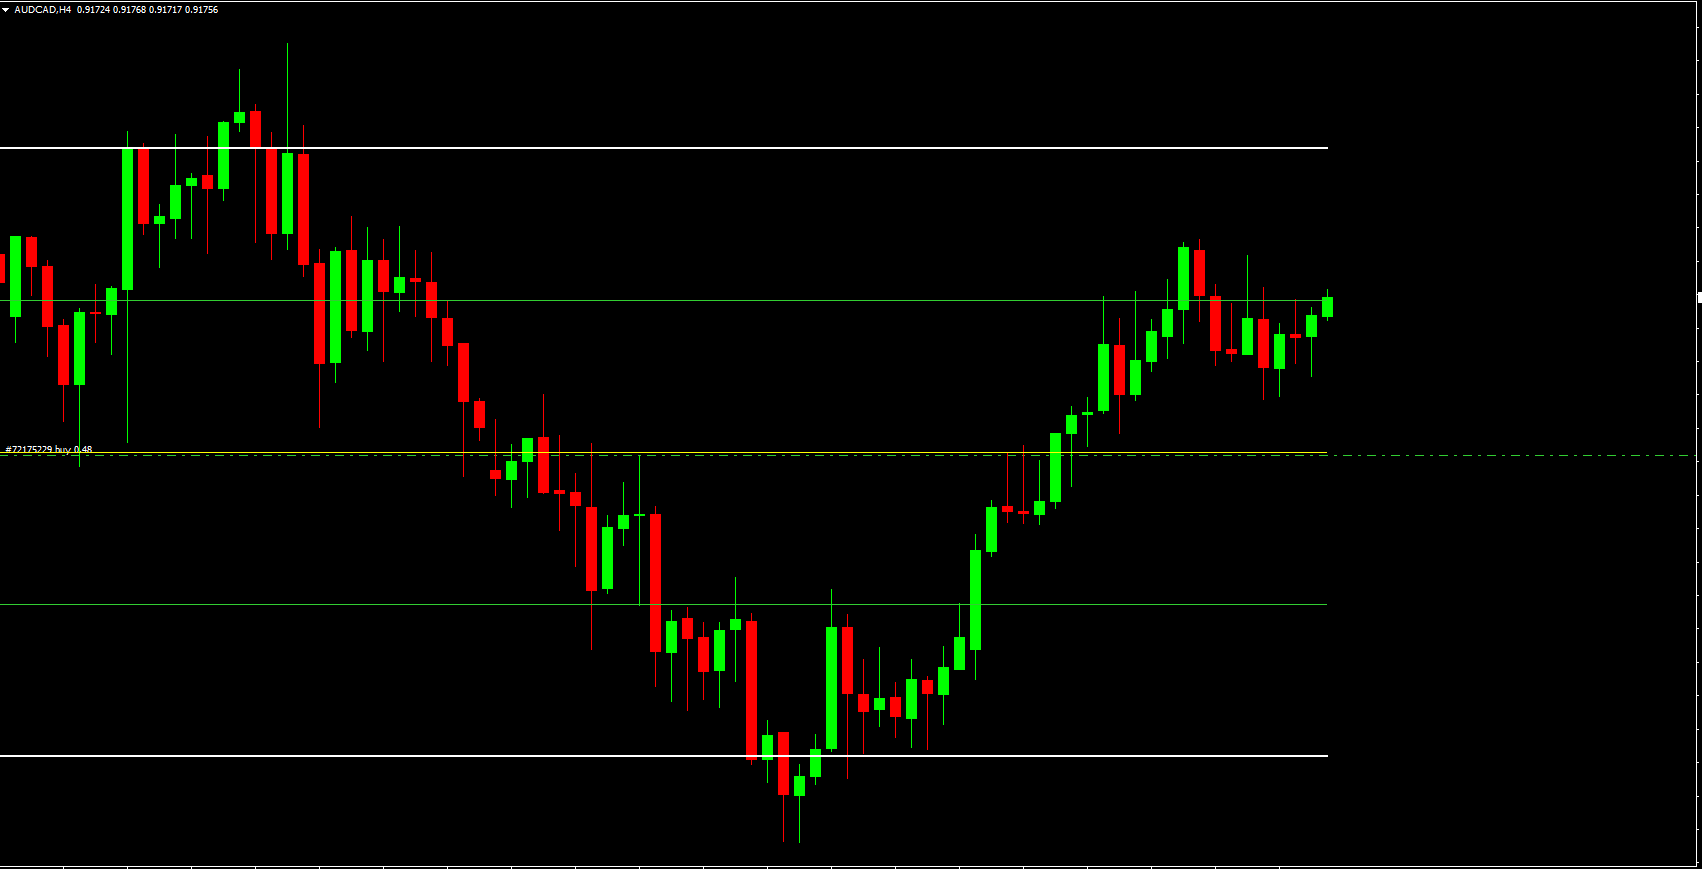
The indicator displays horizontal lines, color-coded to represent these different market phases. These visual cues make it easy for traders to recognize where the market is within its cycle and anticipate potential Support And Resistance levels.
Features of the Quarters Theory Indicator
The Quarters Theory Indicator offers several features that make it an invaluable tool for MT4 traders:
Cycle identification: Highlights the start and end of each market quarter
Color-coded lines: Makes it easy to interpret market phases visually
Support and resistance levels: Provides potential zones for entering or exiting trades
User-friendly design: Easy to set up and interpret, suitable for all levels of traders
By understanding these cycles, traders can gain an edge in timing trades and managing risk effectively.
Benefits of Using the Quarters Theory Indicator
Integrating the Quarters Theory Indicator into your trading strategy can enhance your decision-making in several ways:
Improved trade timing: Helps identify optimal buy and sell points based on market cycles
Enhanced risk management: Support and resistance levels guide stop loss and take profit placement
Market clarity: Color-coded visualization simplifies trend recognition and market analysis
Versatility: Useful for Scalping, intraday trading, and swing trading
Whether you are a beginner or an experienced trader, the indicator provides actionable insights to optimize trade entries, exits, and overall strategy.
Trading Strategies Using the Quarters Theory Indicator
Cycle-Based Entry Strategy
Traders can enter positions at the beginning of Quarter 2 or Quarter 4, where trends tend to gain momentum. Identifying these quarters allows for early positioning in alignment with the market cycle.
Support and Resistance Strategy
Use the horizontal lines generated by the indicator to set potential stop loss and take profit levels. This ensures trades are executed near historically significant price levels, improving risk-to-reward ratios.
Trend Confirmation Strategy
Combine the Quarters Theory Indicator with trend indicators like moving averages or oscillators for additional confirmation before entering trades. This approach reduces false signals and increases trading accuracy.
Best Timeframes for the Quarters Theory Indicator
The Quarters Theory Indicator is effective across multiple timeframes:
Lower timeframes: 1-minute, 5-minute for scalping
Medium timeframes: 15-minute, 30-minute for intraday trading
Higher timeframes: 1-hour, 4-hour for swing trading
Higher timeframes generally provide stronger and more reliable signals, while lower timeframes offer more frequent trading opportunities.
Final Thoughts on the Quarters Theory Indicator
The Quarters Theory Indicator is a unique and powerful MT4 tool that helps traders understand the cyclical nature of the Forex market. By identifying distinct quarters, highlighting support and resistance levels, and providing clear visual cues, it enables traders to time entries and exits more effectively and improve overall trading performance.
👉 Visit IndicatorForest.com to explore more free MT4 indicators, professional trading tools, and Forex strategy guides.
7 Downloads
Published:
Dec 27, 2025 13:19 PM
Category: