Master Market Volatility: The Ultimate Guide to the RAVI Indicator for MT5
In the complex landscape of financial trading, one of the most critical challenges is distinguishing between a trending market and a ranging one. For traders utilizing the MetaTrader 5 (MT5) platform, the Range Action Verification Index (RAVI) has become a fundamental tool for solving this dilemma. Developed by Tushar Chande, the RAVI indicator is specifically designed to identify the birth of a trend and quantify the intensity of market momentum, ensuring traders enter positions with high-probability conviction.
What is the RAVI Indicator?
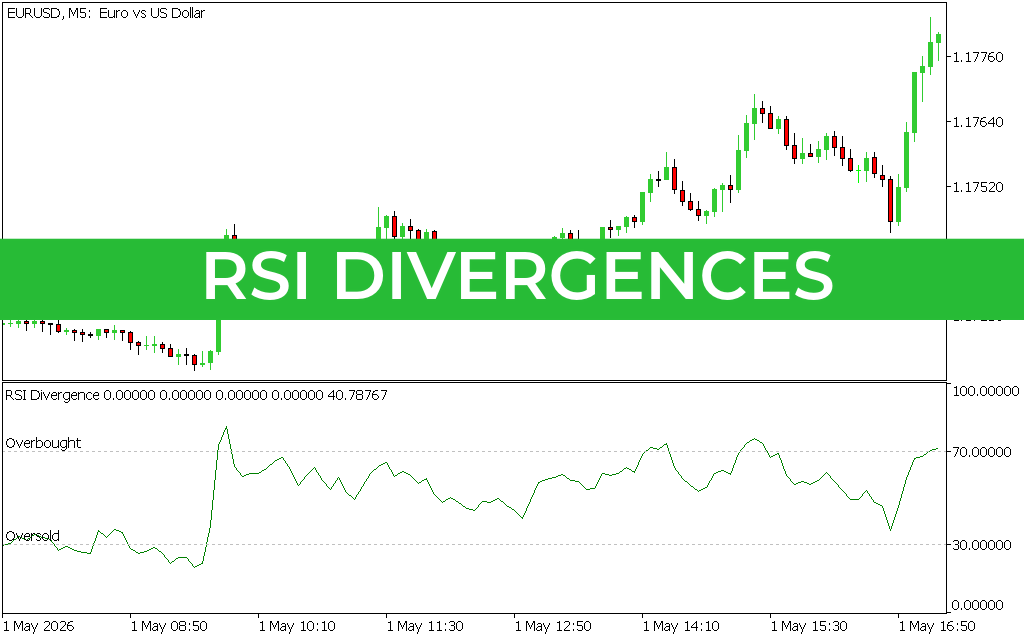
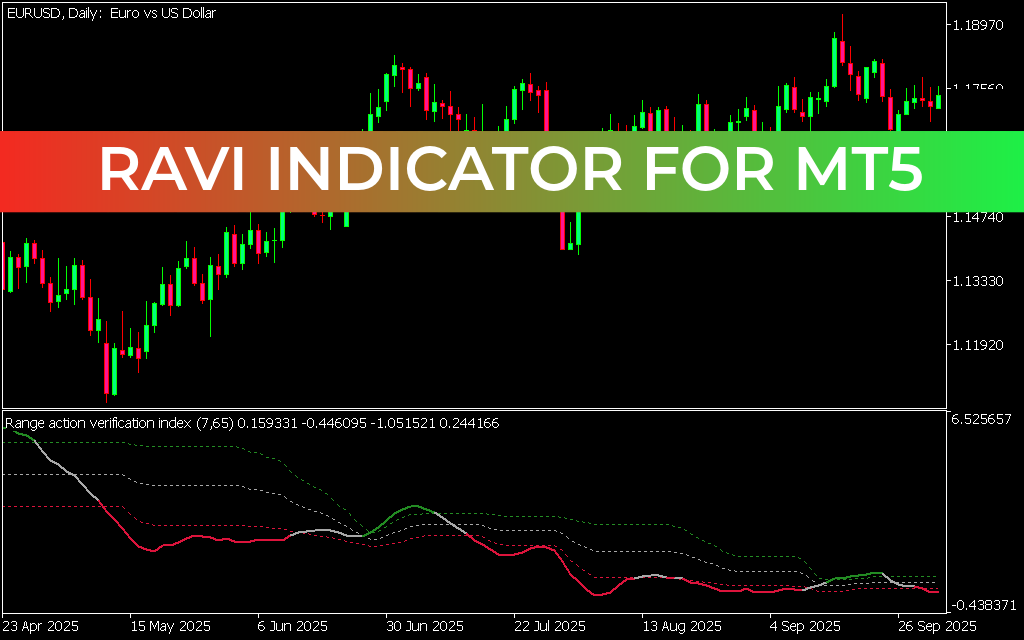
The RAVI (Range Action Verification Index) is a momentum-based oscillator that calculates the absolute percentage spread between two moving averages—typically a short-term moving average (7 periods) and a long-term moving average (65 periods). Unlike standard oscillators that merely show overbought or oversold conditions, RAVI focuses on trend verification.
As seen in the EURUSD Daily chart, the indicator is displayed in a separate window below the Price Action. It features a zero-line and specific threshold levels (often set at 0.3% or 1.0% depending on the asset). When the RAVI line moves outside these thresholds, it objectively confirms that a trend is active and gaining strength.
Why Use RAVI on MetaTrader 5?
The MT5 version of the RAVI indicator offers superior processing speed and visual clarity, making it ideal for modern technical analysis. Here is why it is an essential addition to your setup:
- Objective Trend Identification: RAVI removes the guesswork. If the indicator is flat or within its threshold bands, the market is ranging. Once it breaks out, the trend is "verified."
- Momentum Quantification: The steeper the slope of the RAVI line, the stronger the momentum. This helps traders distinguish between a weak "creep" and a powerful institutional move.
- Versatility Across Timeframes: Whether you are Scalping on the M5 chart or swing trading on the Daily timeframe, the RAVI adapts its sensitivity to provide accurate readings.
- Early Warning System: By watching for the RAVI line to curl back toward the zero-line, traders can spot trend exhaustion early, allowing for timely profit-taking before a reversal occurs.
Strategic Implementation
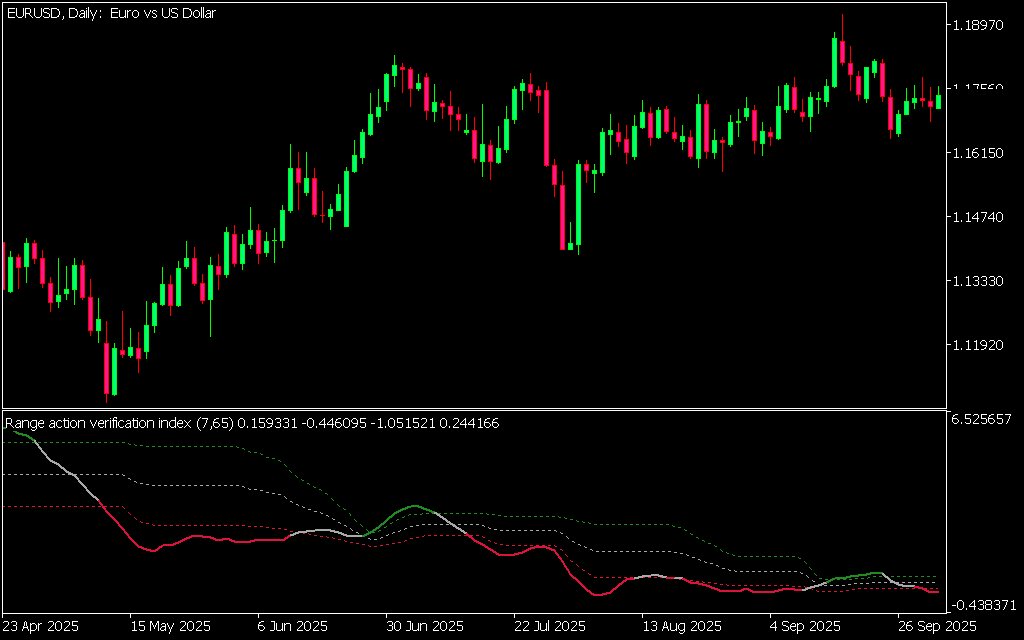
The most effective way to trade with the RAVI is to use it as a Volatility Filter. In the provided daily chart, notice how periods of consolidation result in a "flat" indicator line. As soon as the price breaks a structure and the RAVI line spikes, it confirms a high-probability entry.
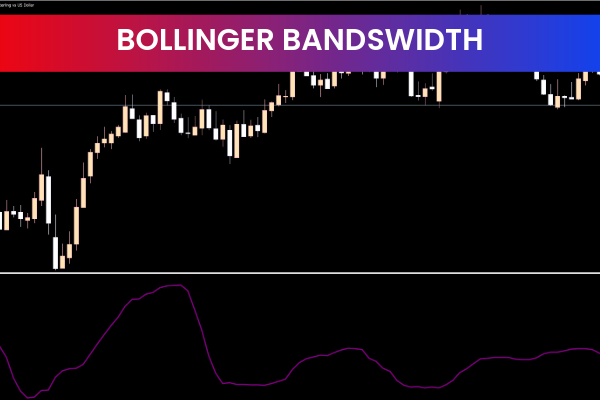
Traders often combine RAVI with other tools, such as the Moving Average Convergence Divergence (MACD) or Bollinger Bands. In this synergy, the RAVI acts as the "green light"—you only take signals from your primary strategy when the RAVI confirms that the market is actually trending. This prevents the "death by a thousand cuts" that many traders experience during sideways markets.
Conclusion
The RAVI Indicator for MT5 is a professional-grade utility for traders who prioritize data-driven execution. By providing a clear, mathematical verification of market state, it transforms how you perceive price action. Incorporate the RAVI into your MT5 platform today to filter out market noise and capture the most explosive trends with confidence.
1 Download
Last Update:
May 08, 2026 01:27 AM
Published:
Jan 26, 2026 13:53 PM
Category: